Google Trends Time Series Analysis
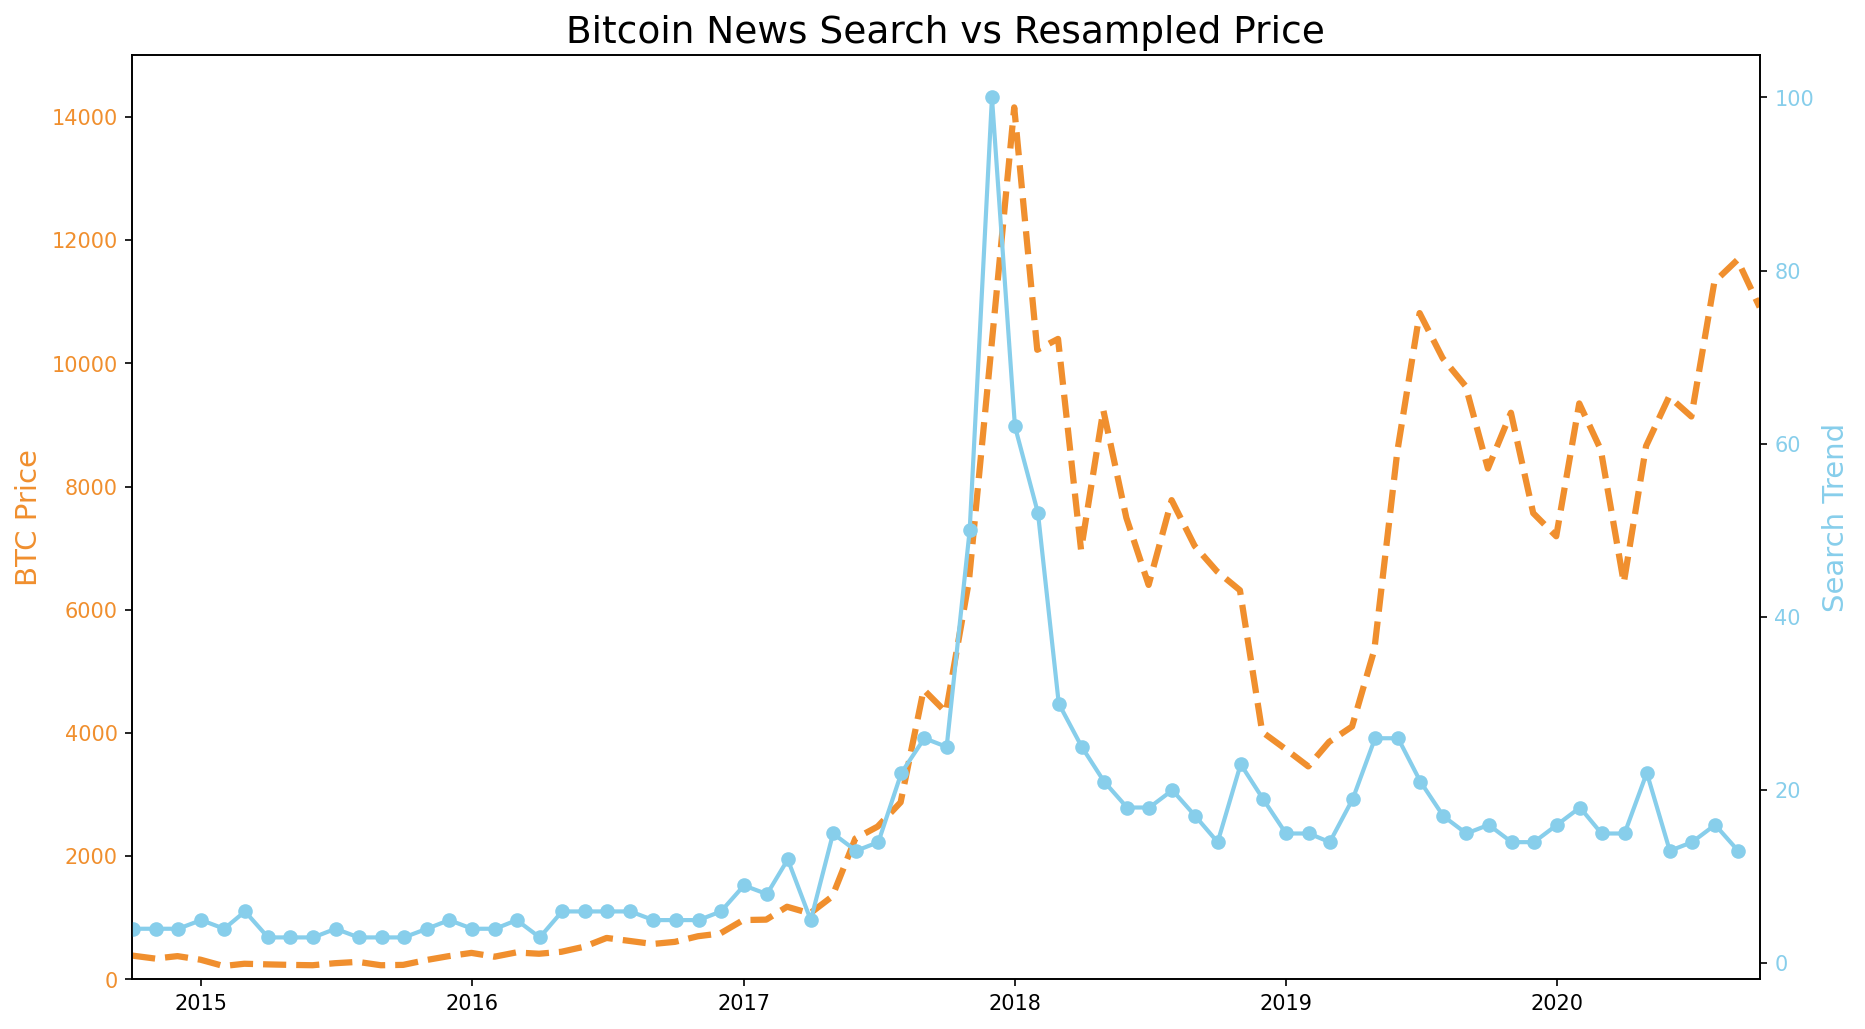
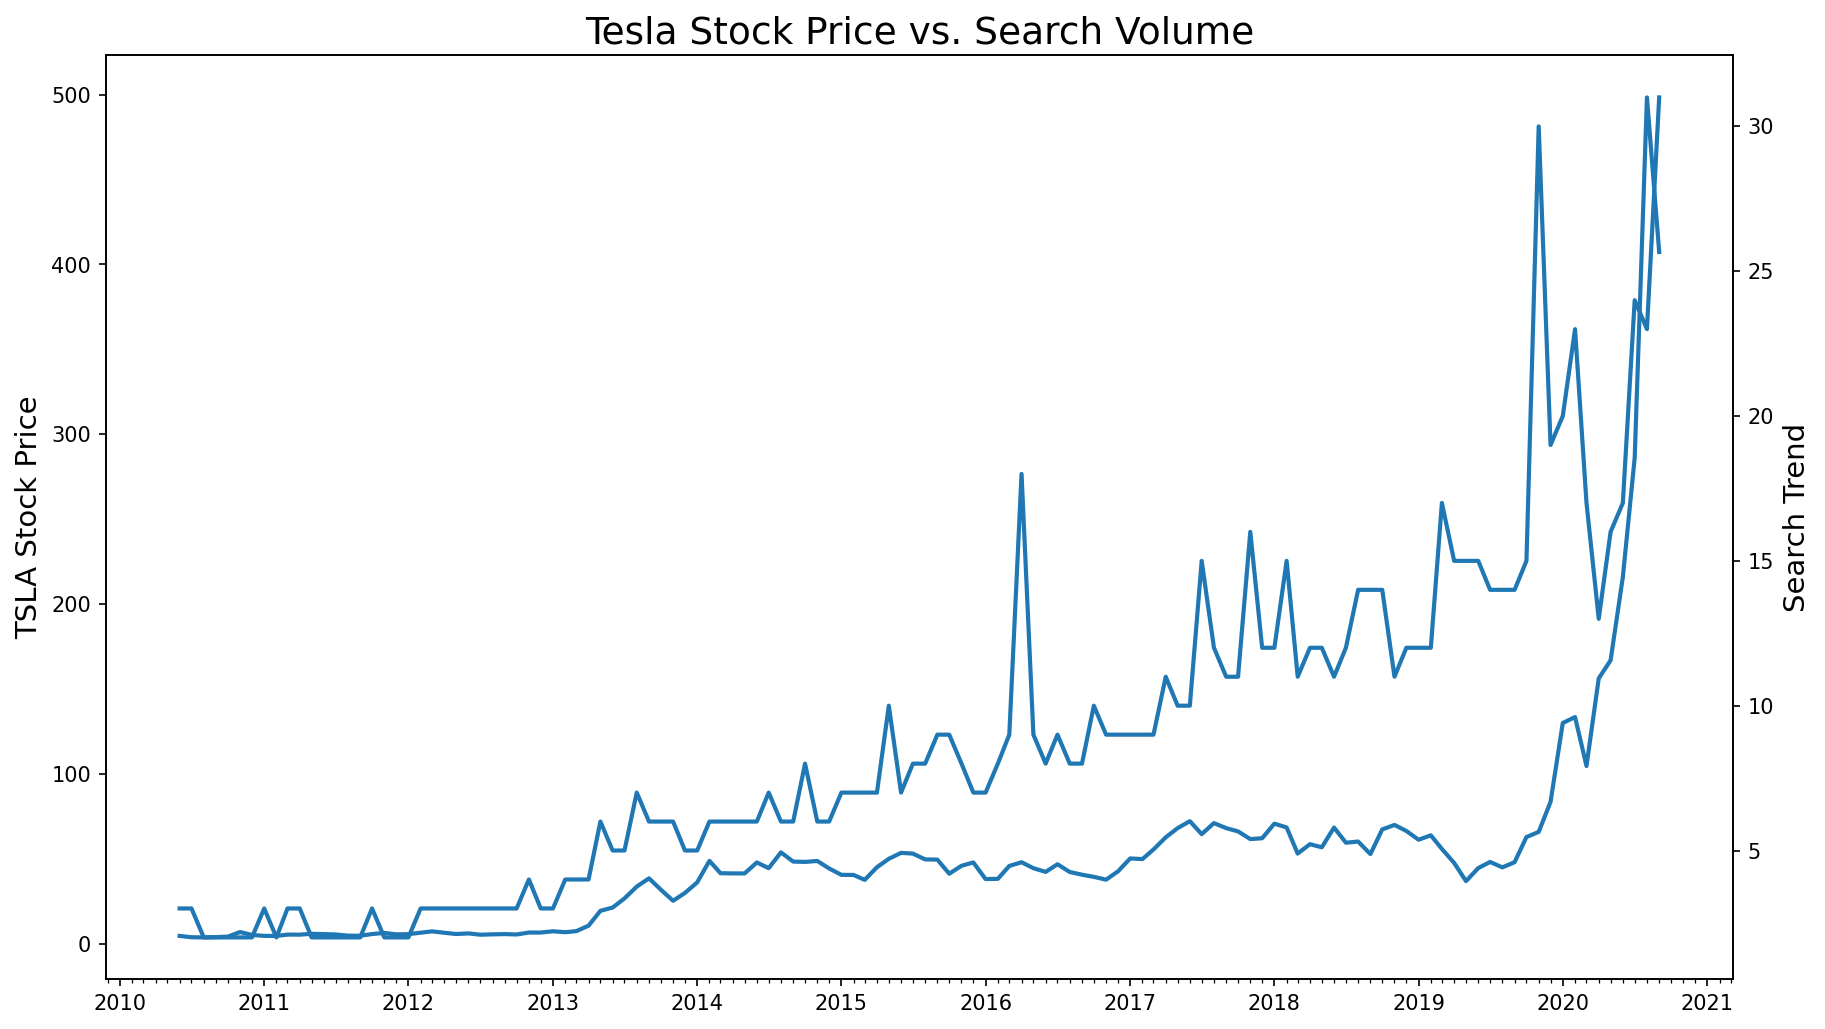
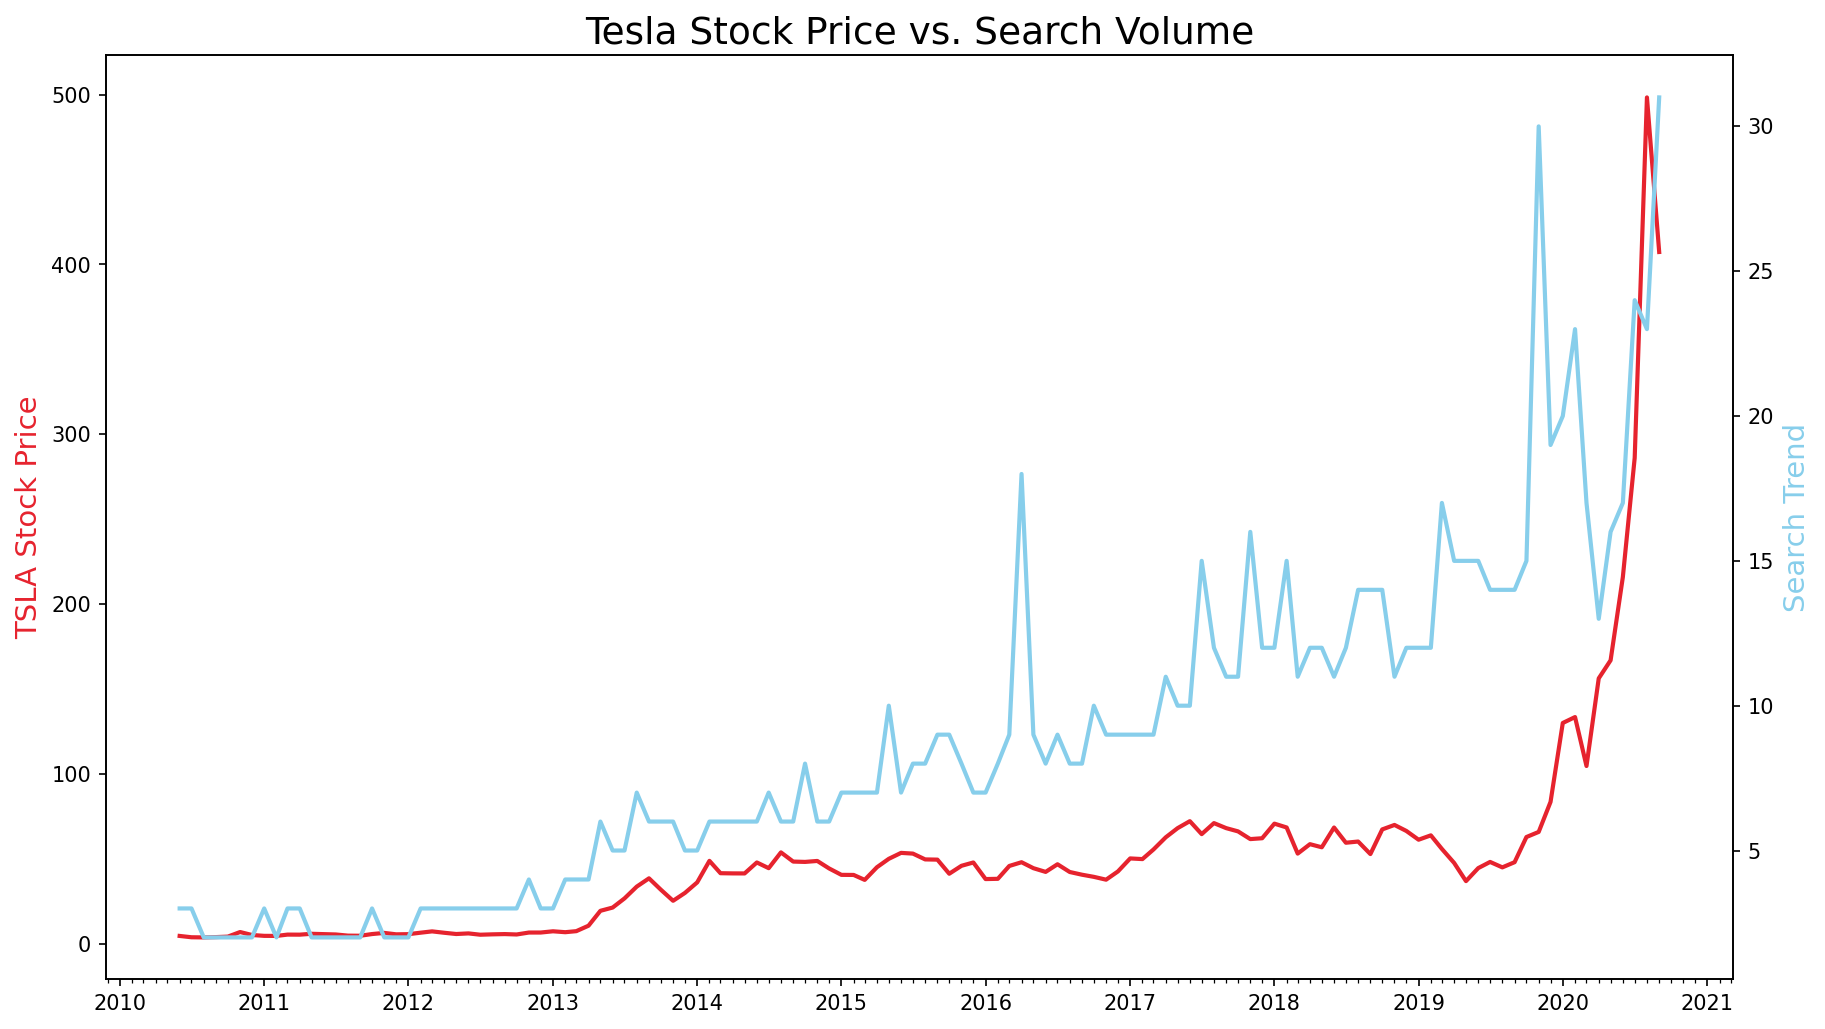
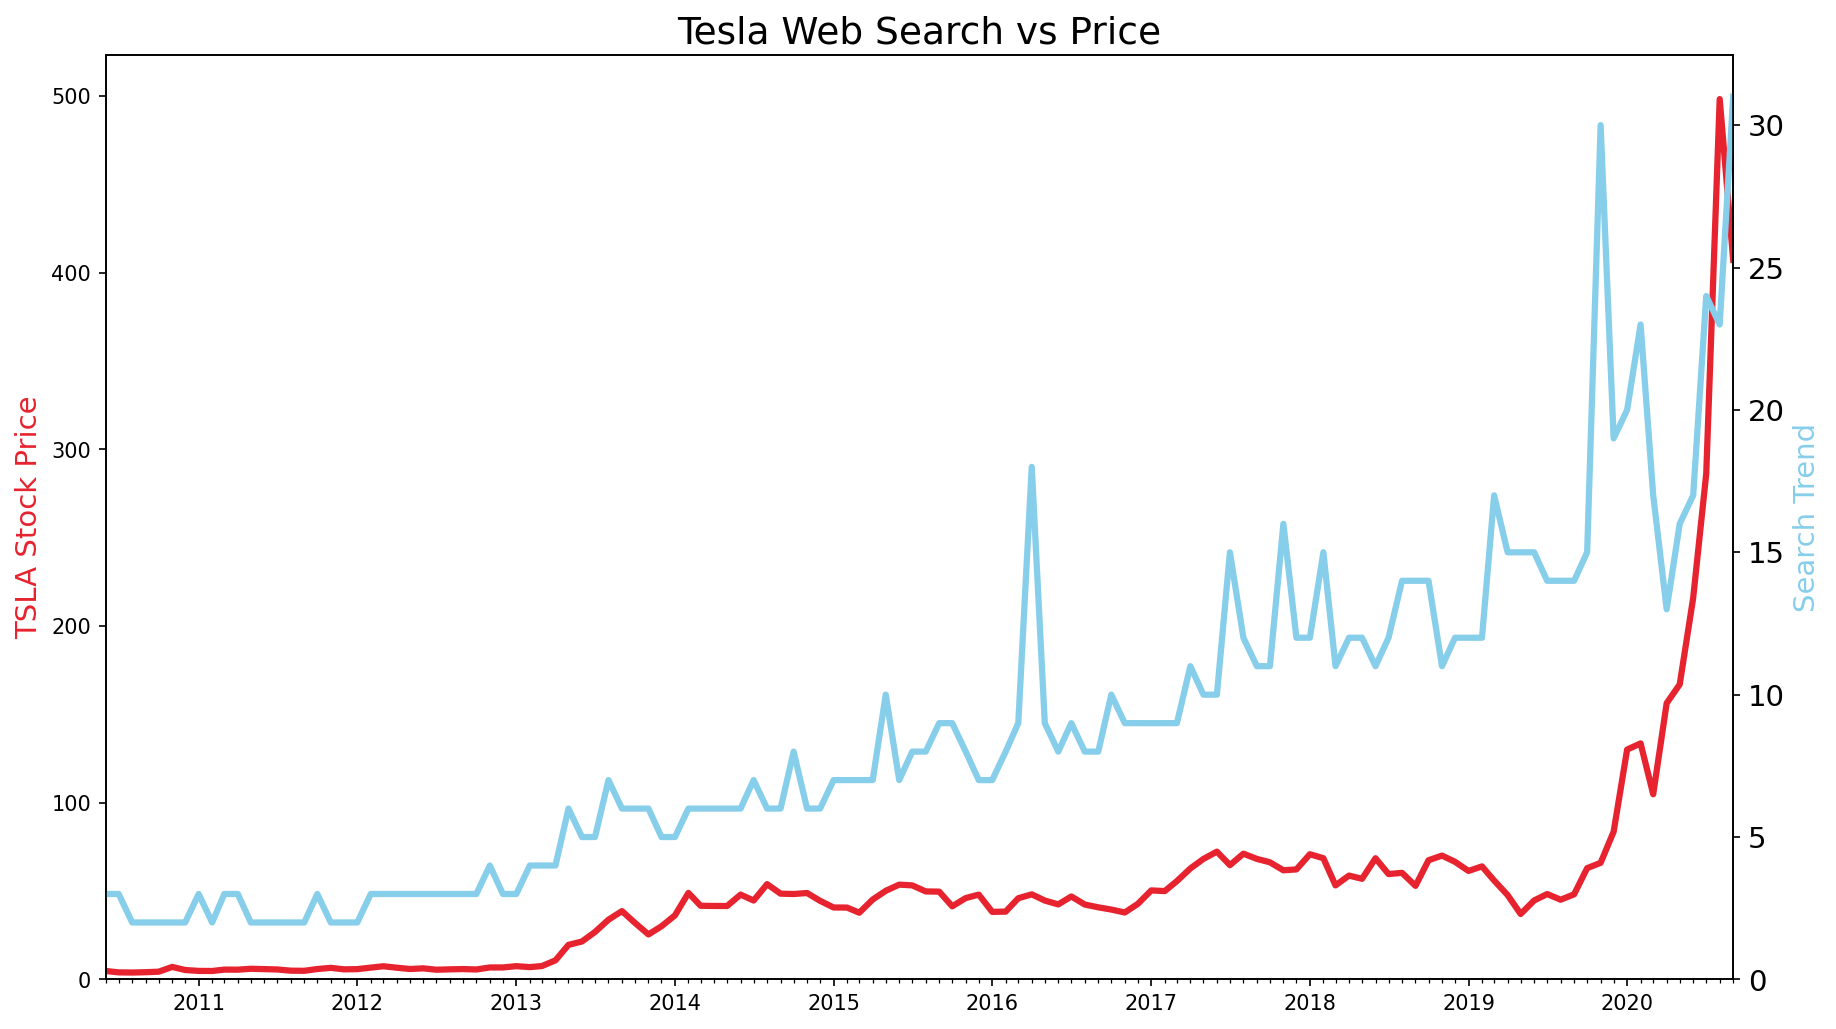
This project asks whether public search interest — measured by Google Trends — reflects, anticipates, or follows real-world financial and economic outcomes. Three signal pairs are examined: Tesla stock price against web search popularity, Bitcoin market price against news search volume, and the official US unemployment rate against search interest in "unemployment benefits." The core analytical challenge is frequency mismatch: Bitcoin price data is daily, while search data and unemployment figures arrive monthly. Resolving this requires resampling daily Bitcoin prices to month-end values before any comparison is valid. Rolling average smoothing is applied to unemployment search data to separate structural trend from seasonal noise.
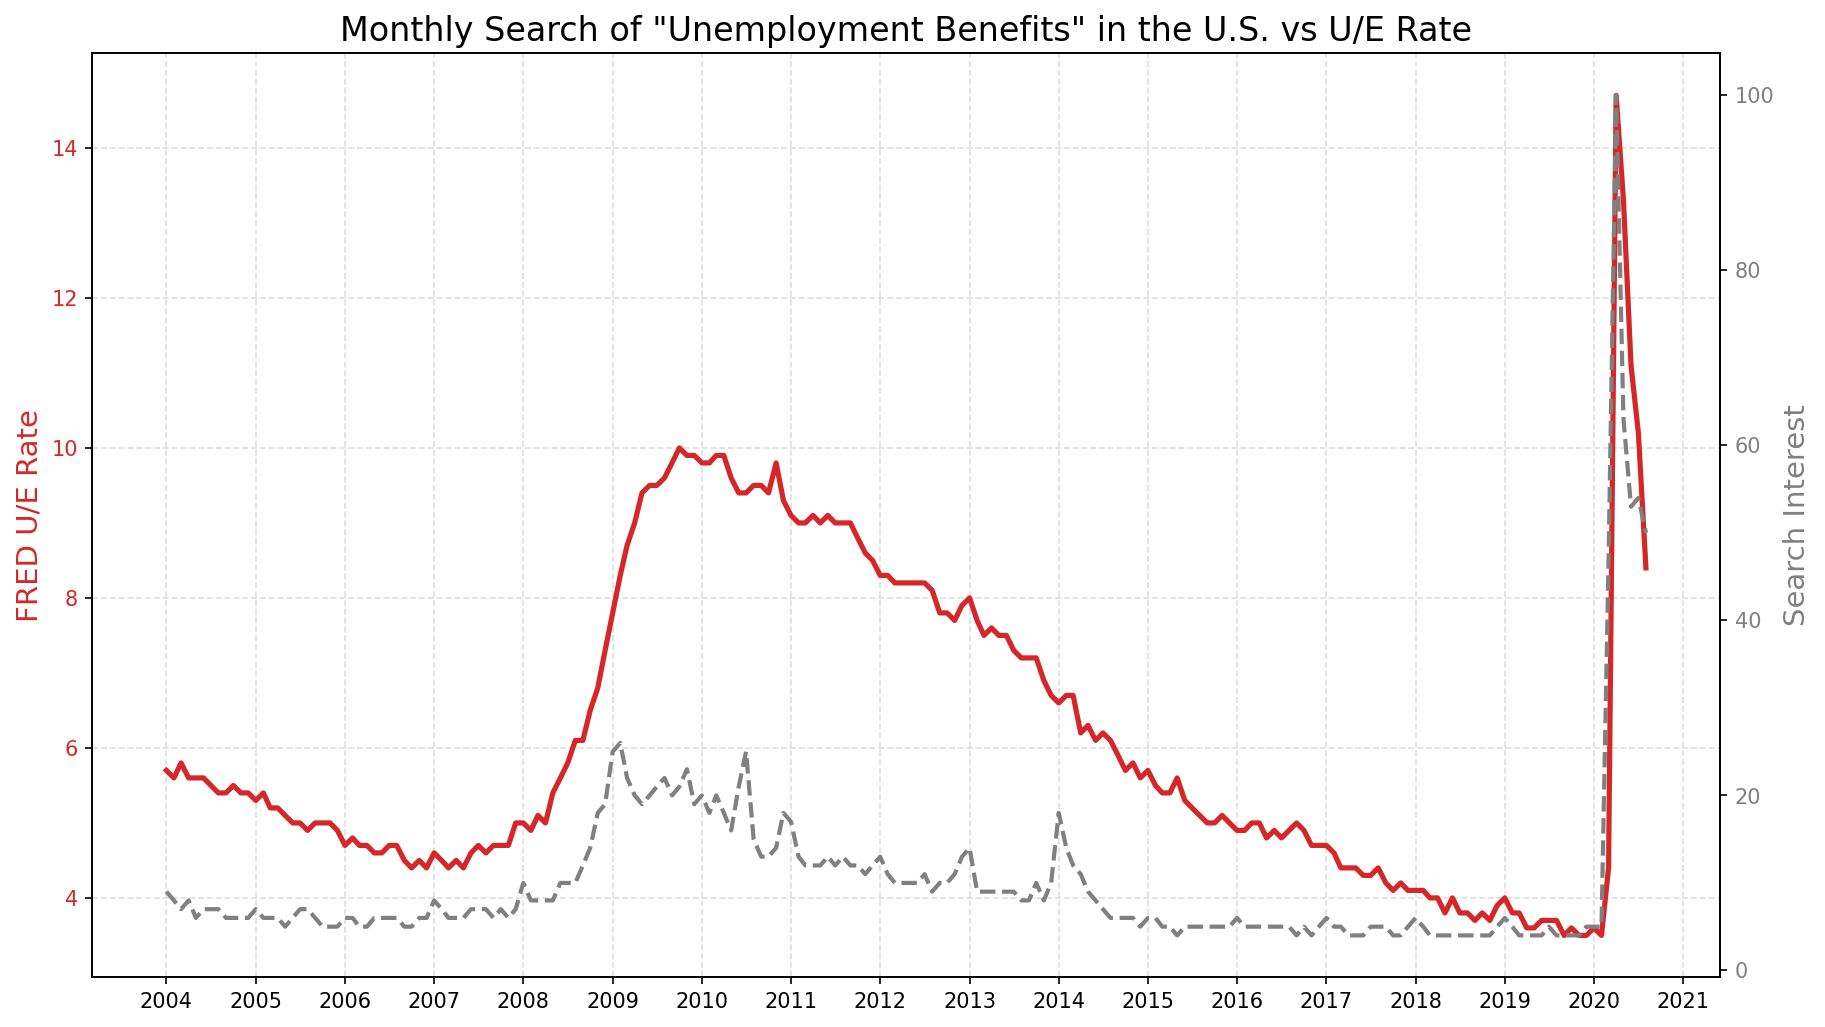
The most striking result is the COVID-19 unemployment shock in 2020. Search interest for "unemployment benefits" and the official FRED unemployment rate spiked simultaneously — compressing a pattern that normally unfolds over quarters into a matter of weeks. Adding 2020 data also exposes a data integrity issue: Google Trends normalises index values to 100 within the selected period, so extending the range rescales the entire historical baseline. For Bitcoin, search volume leads price in several cycles — interest peaks one to two months before price does during speculative runs, then diverges during consolidation. Tesla search volume correlates more strongly with news events and product announcements than with earnings, with price movements often producing no visible search response while public controversies produce clear spikes.
Quick Facts
Overview
Problem
The three datasets operate at incompatible time frequencies: Bitcoin price is daily, Google Trends search data is monthly, and unemployment figures are monthly but seasonally noisy. Direct comparison is not possible until all signals share a common timeline and resolution. A secondary problem is the Google Trends normalisation behaviour — adding a new time period rescales all existing values, which affects how historical charts read and requires awareness when interpreting any cross-period comparison.
Solution
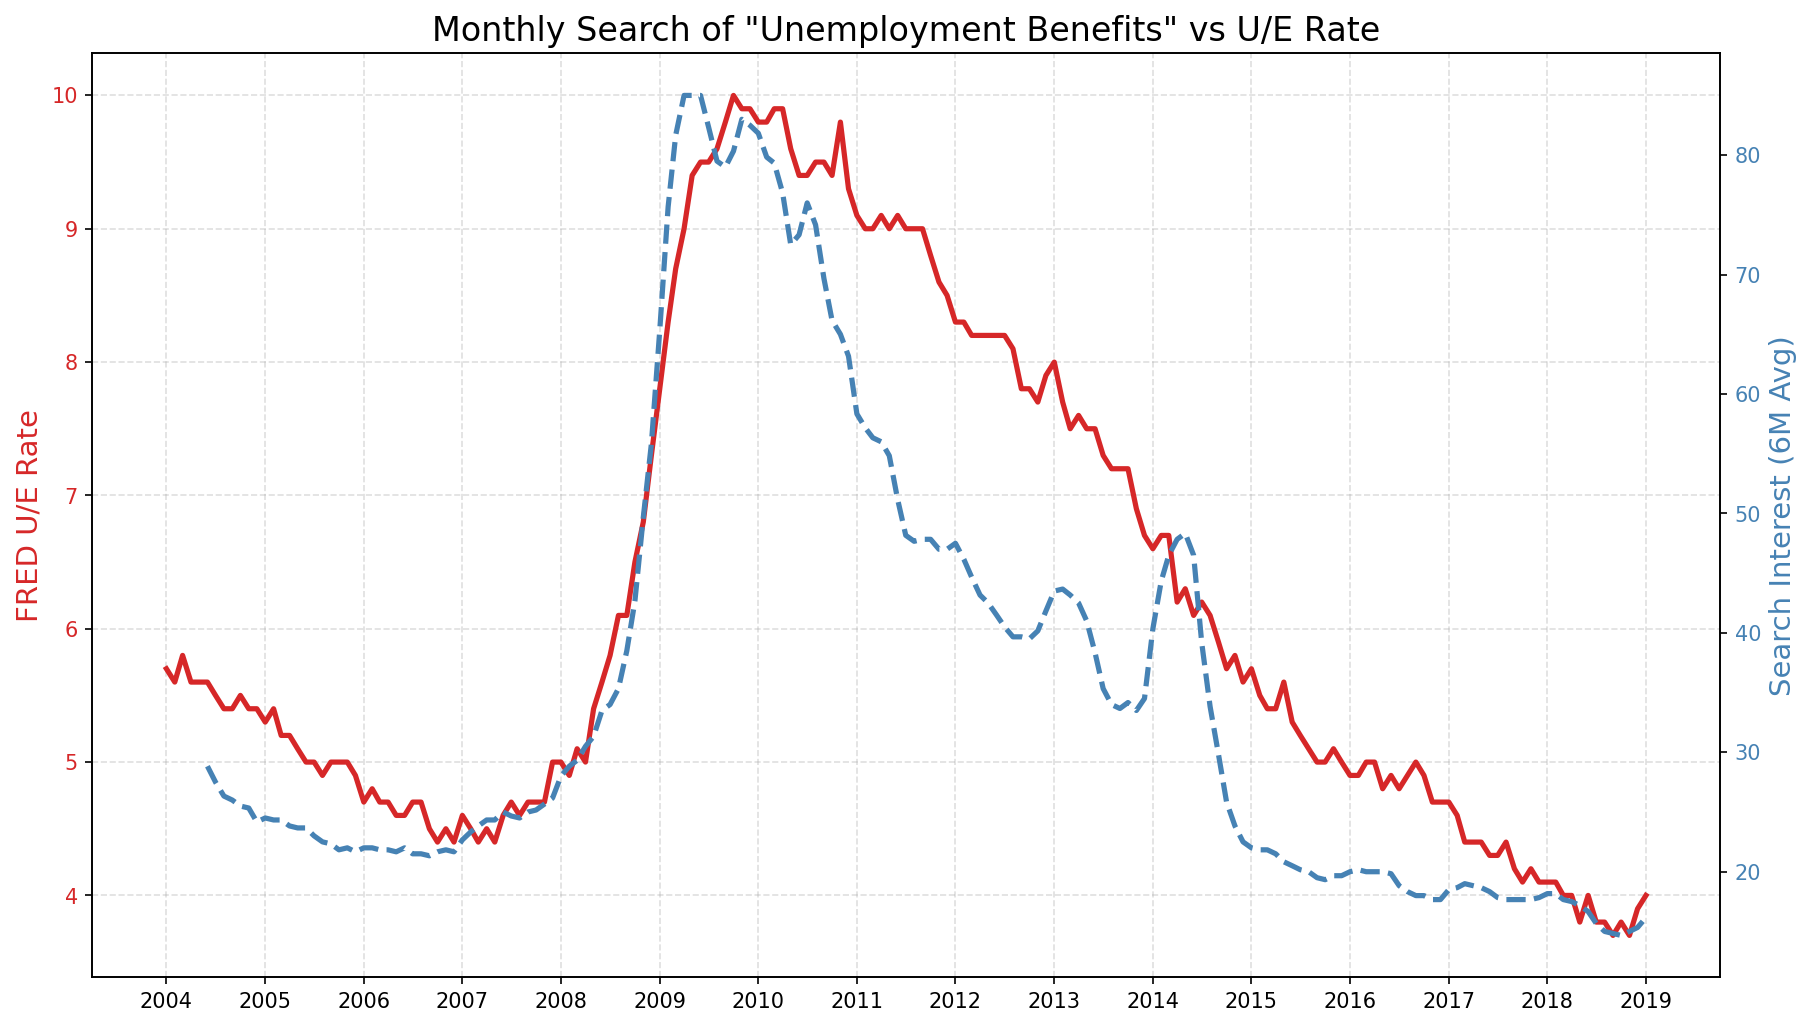
Daily Bitcoin prices are resampled to month-end frequency using pandas `.resample('ME').last()`, producing a monthly series that aligns directly with the search data. All date columns are parsed from strings to datetime objects to enable time-axis operations. A 6-month rolling average is applied to unemployment search data to smooth seasonal spikes and expose the underlying structural trend. Dual-axis Matplotlib charts with `twinx()` allow metrics on different scales — price in USD and search index 0–100 — to be compared visually on a single chart without distortion.
Challenges
The most technically interesting issue is Google Trends normalisation. When the 2020 dataset is added, Trends rescales all values so the maximum within the new period equals 100. This means the historical 2004–2019 search values are compressed downward — the same events look quieter in the extended chart than they did in the original. This is not a visual glitch but a fundamental data integrity constraint that affects interpretation: conclusions drawn from the 2004–2019 chart do not transfer directly to the 2004–2020 chart because the index values refer to different scales.
Results / Metrics
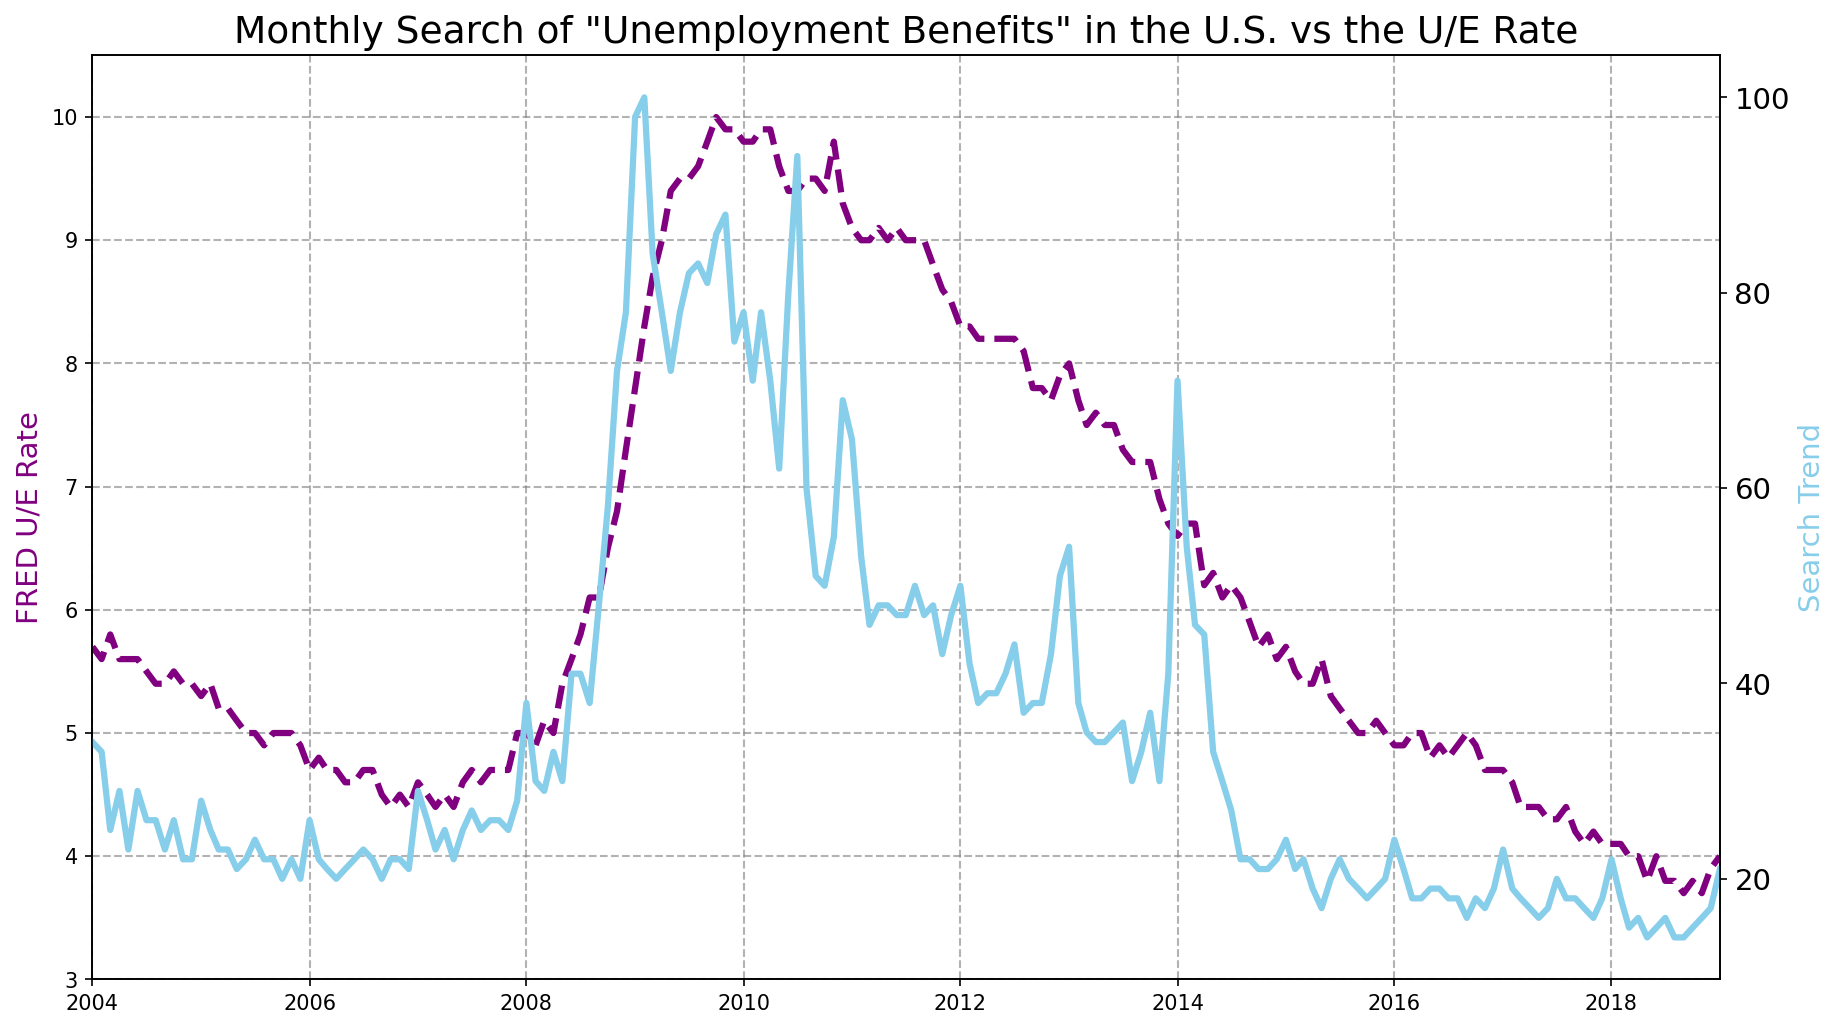
The COVID-19 shock in 2020 produced an unprecedented simultaneous spike in both the official unemployment rate and search interest for "unemployment benefits" — the two signals moved together rather than one leading the other, which is the opposite of the pattern seen in the 2008–2010 recession. Bitcoin search interest leads price in multiple speculative cycles, with search peaks arriving one to two months ahead of price peaks. Tesla search volume responds to news events and product announcements rather than financial performance — earnings beats are largely invisible in the search data while high-profile public events produce clear and immediate spikes. The 6-month rolling average applied to unemployment search data reveals the structural employment cycle beneath the recurring seasonal search pattern, making trend direction unambiguous.
Screenshots
Click to enlarge.
Click to enlarge.
Videos
No videos available yet.