Hypothesis Testing Explorer — scipy and PySpark
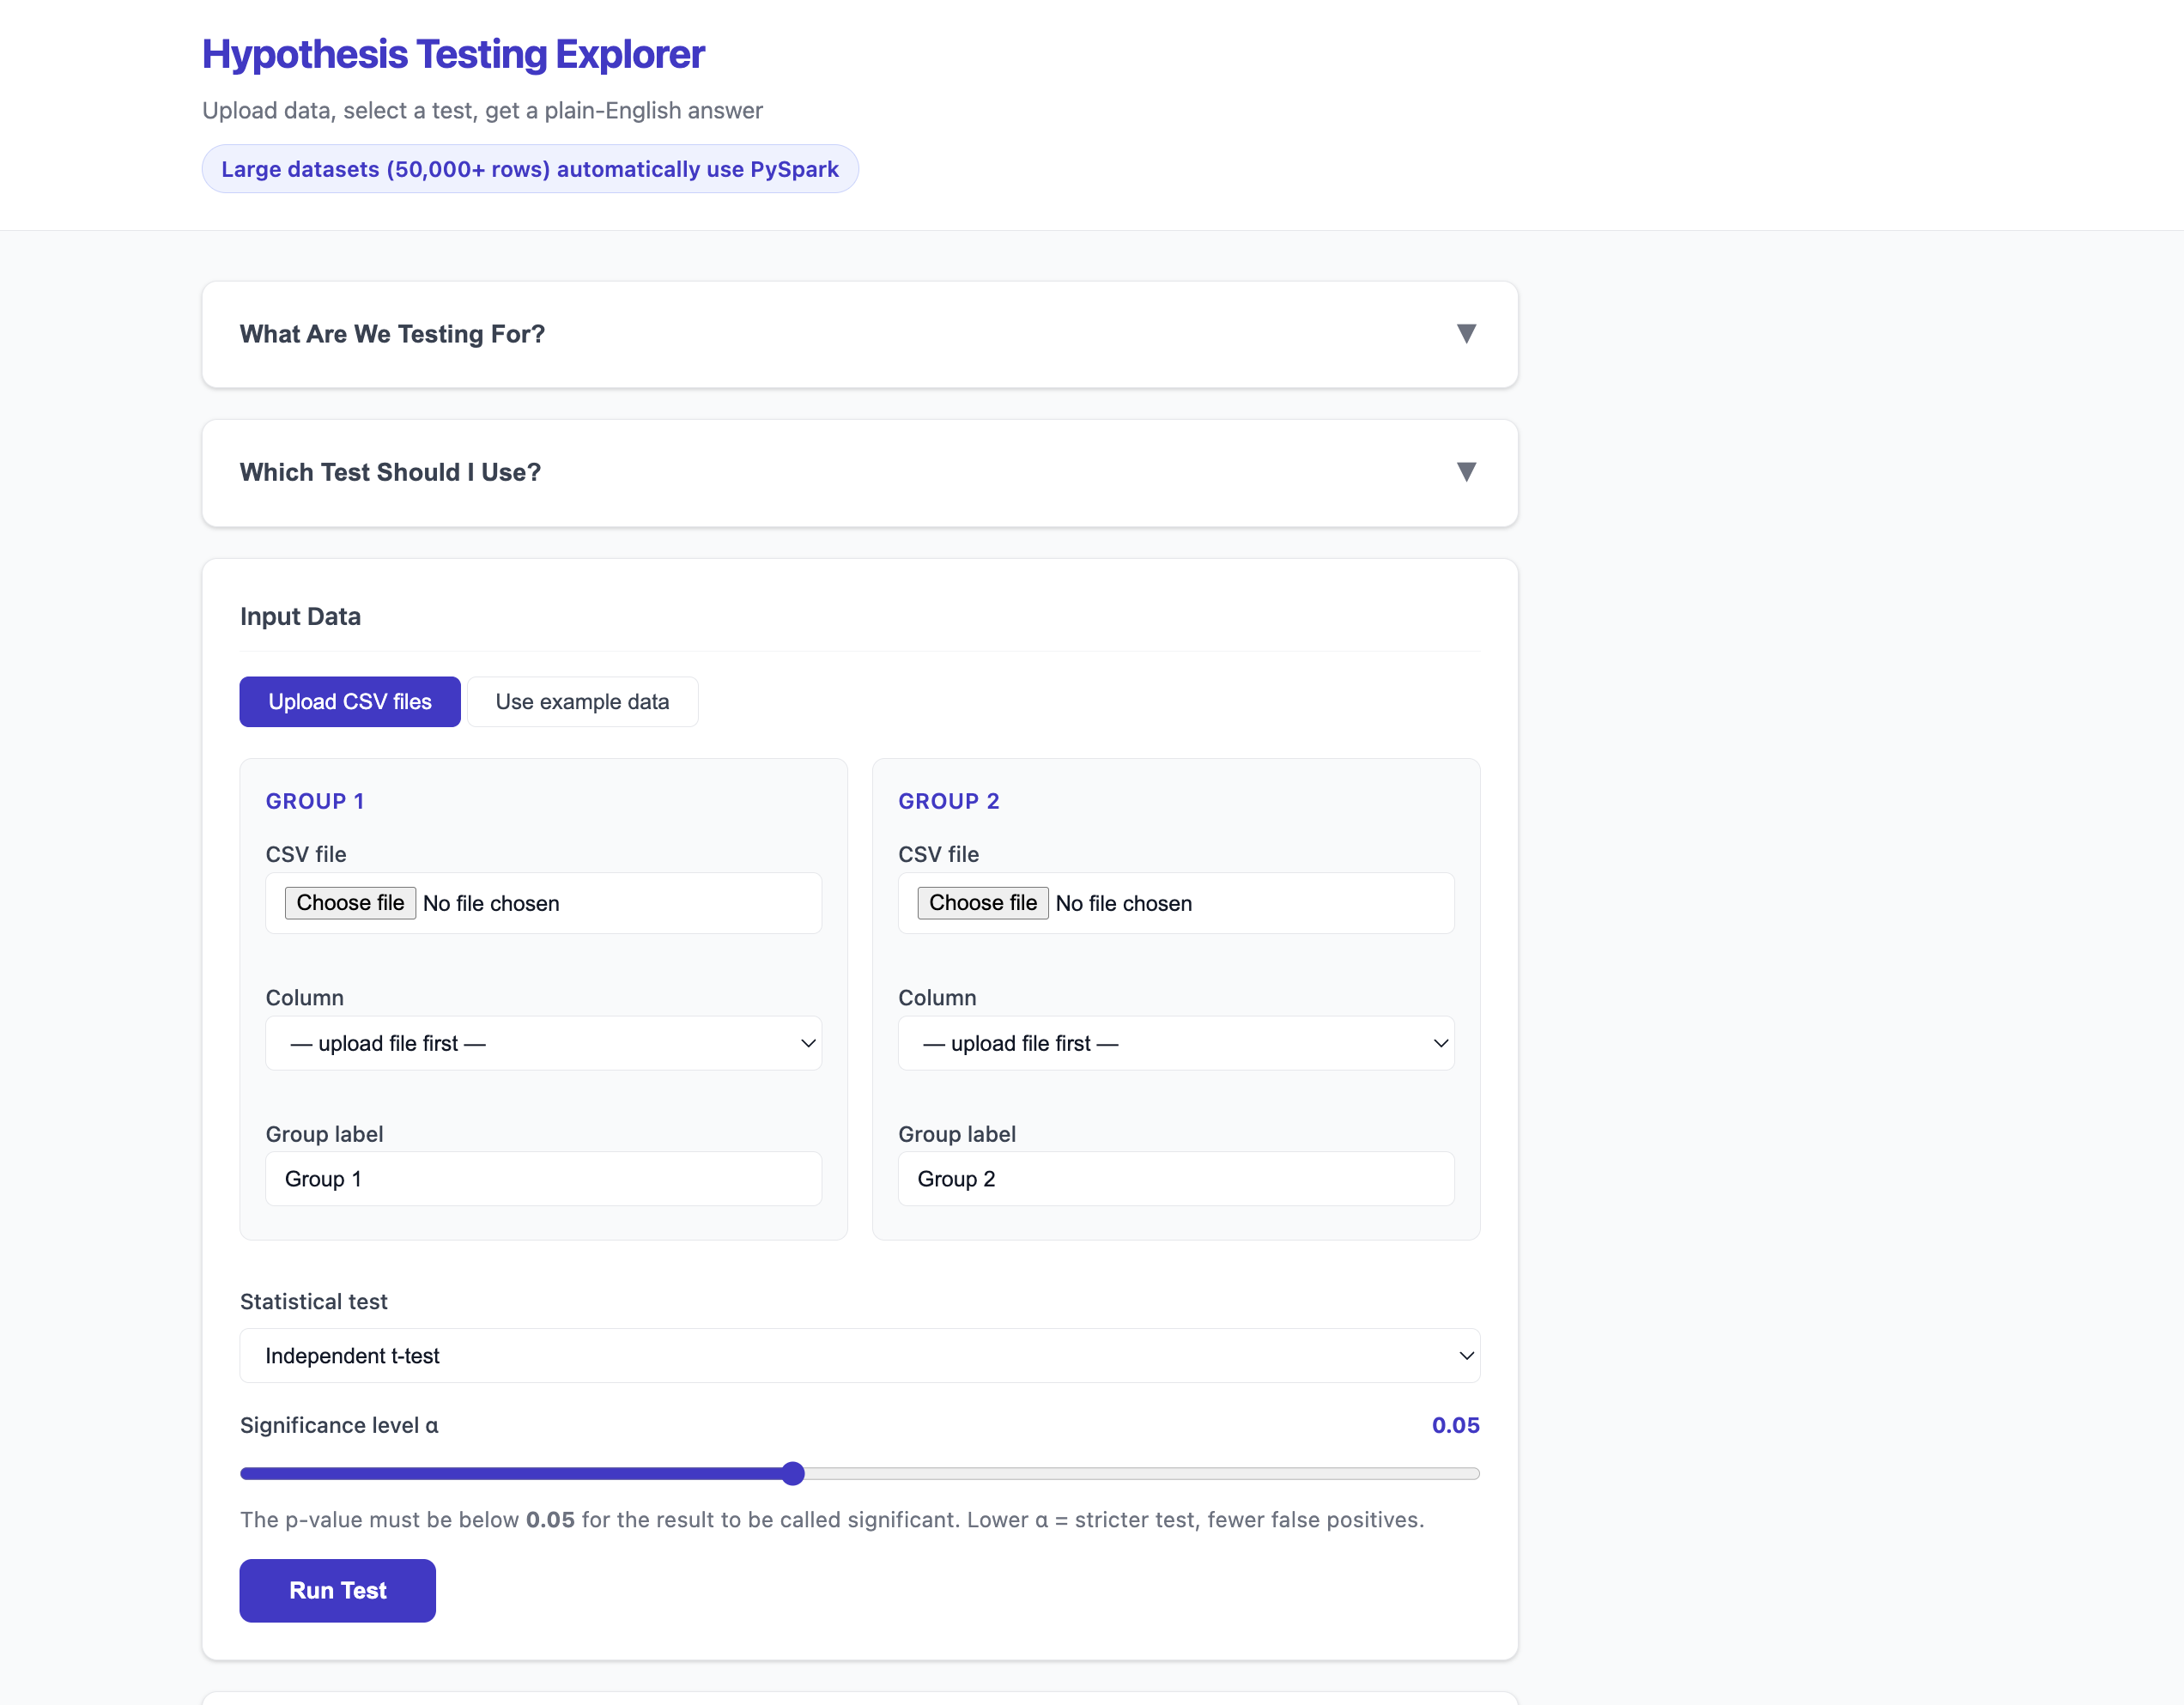
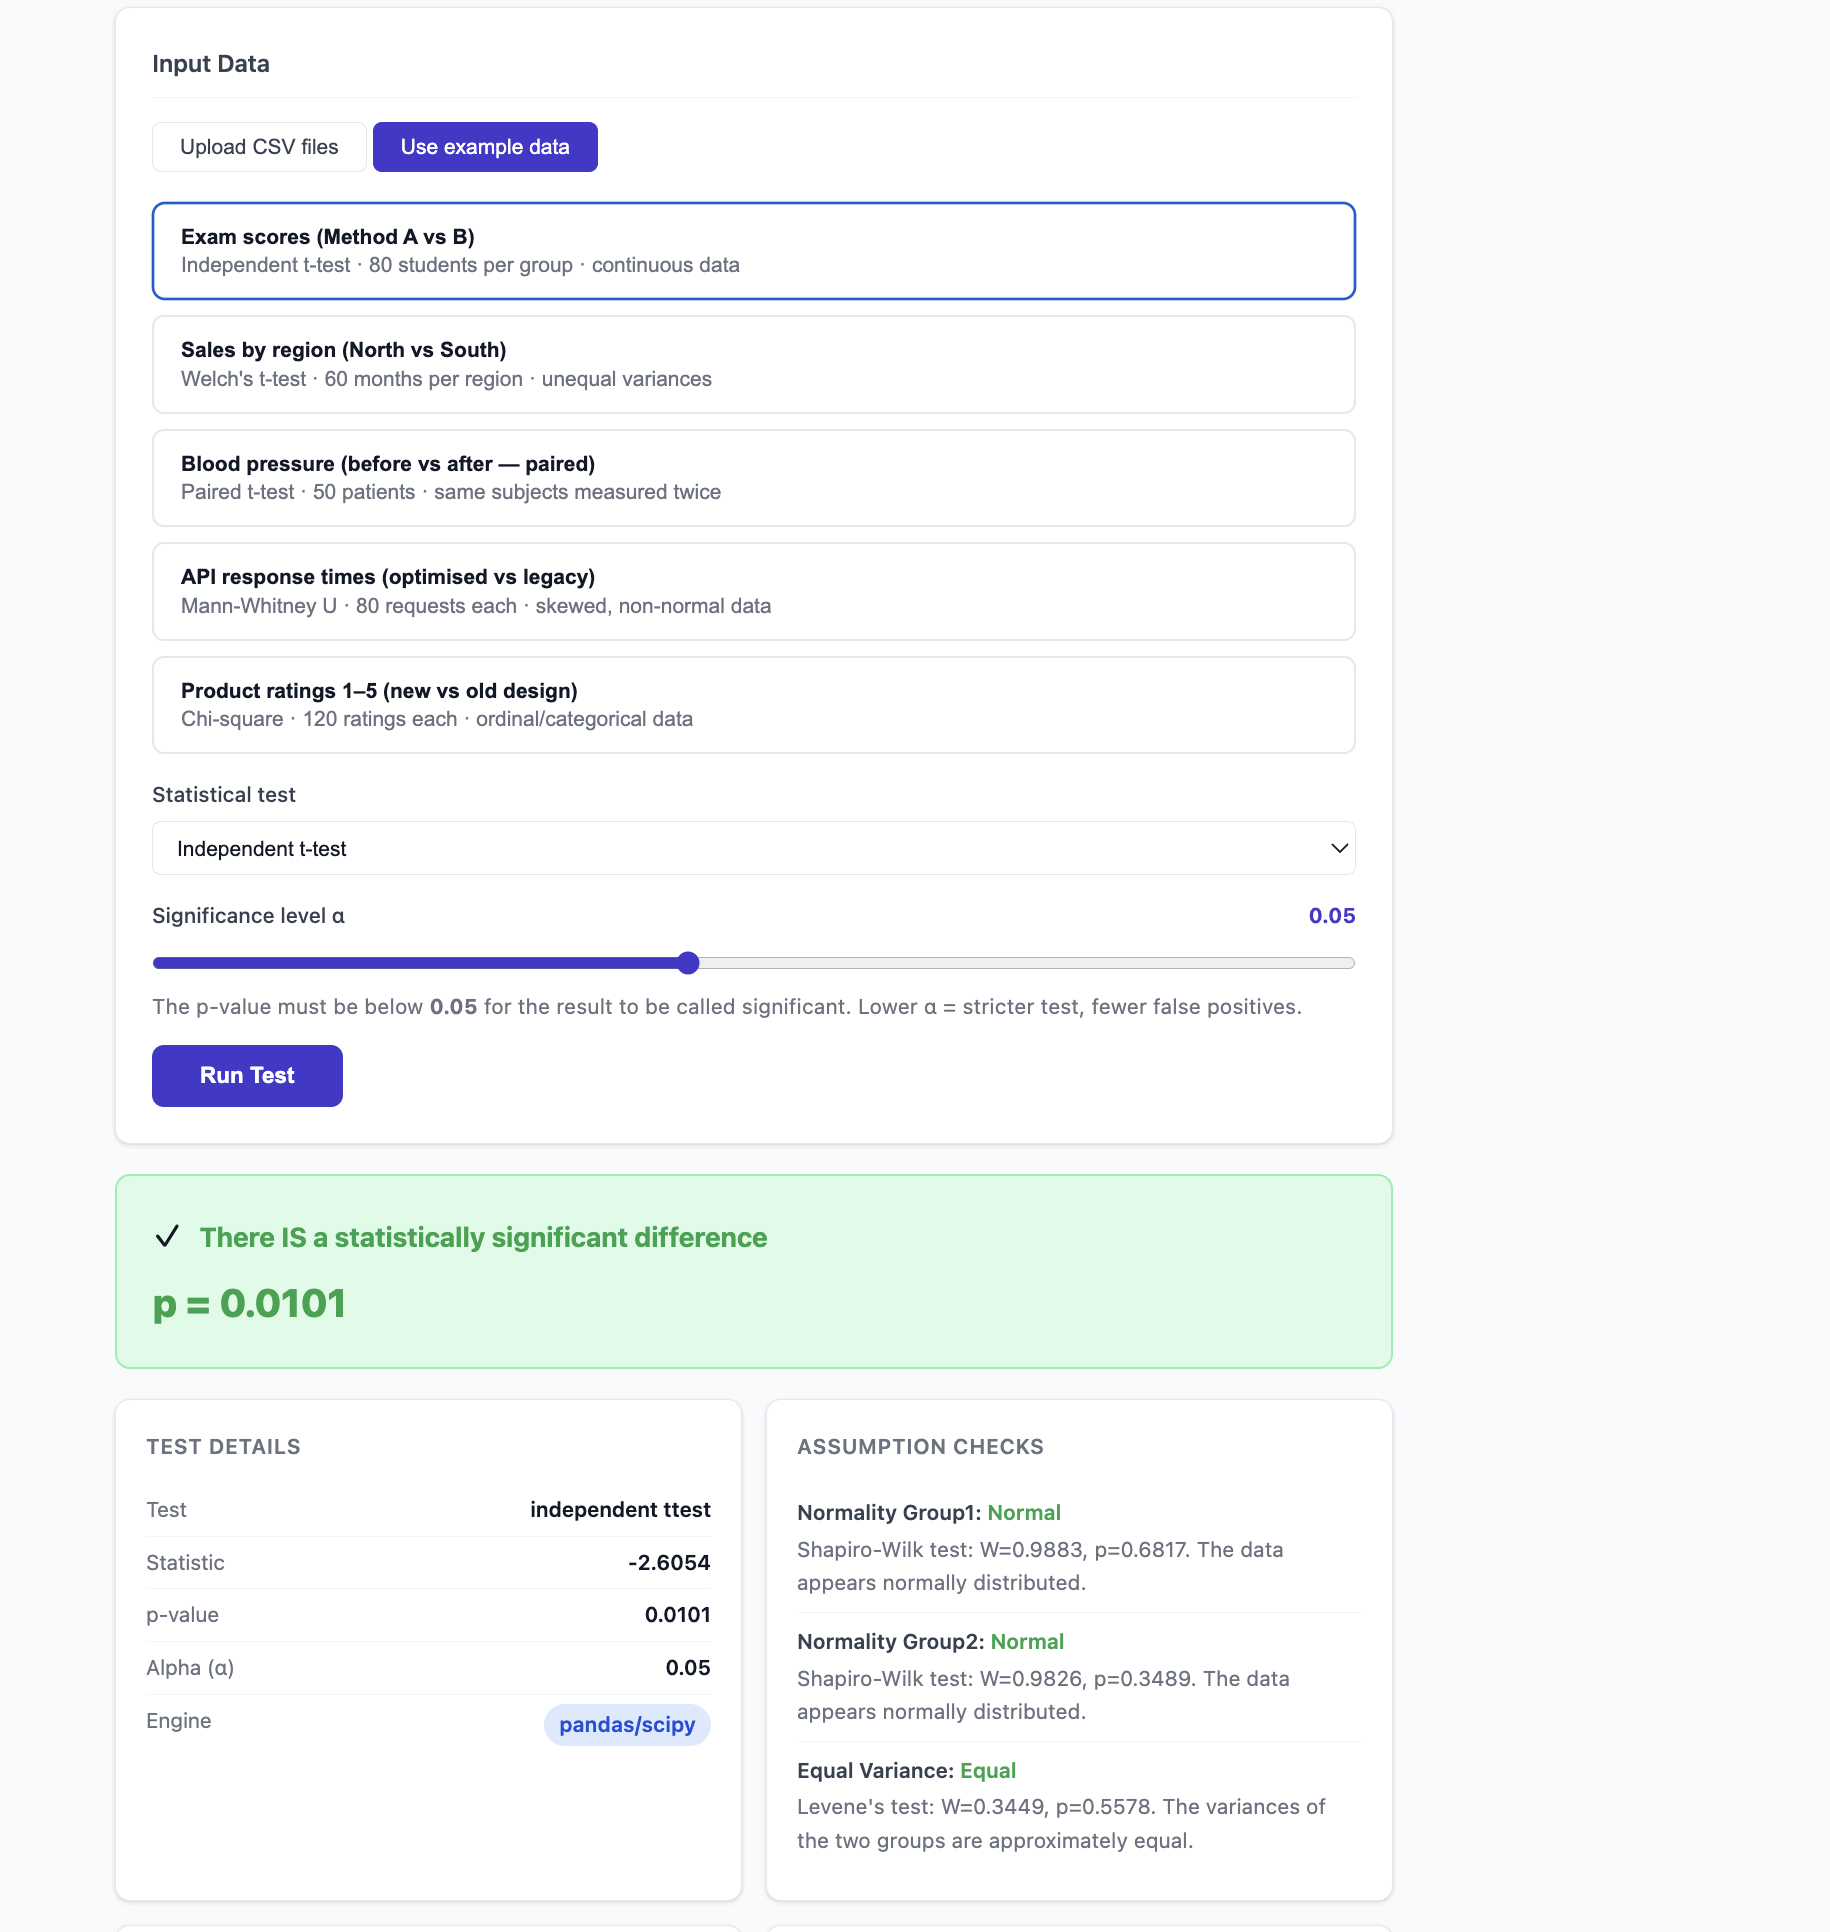
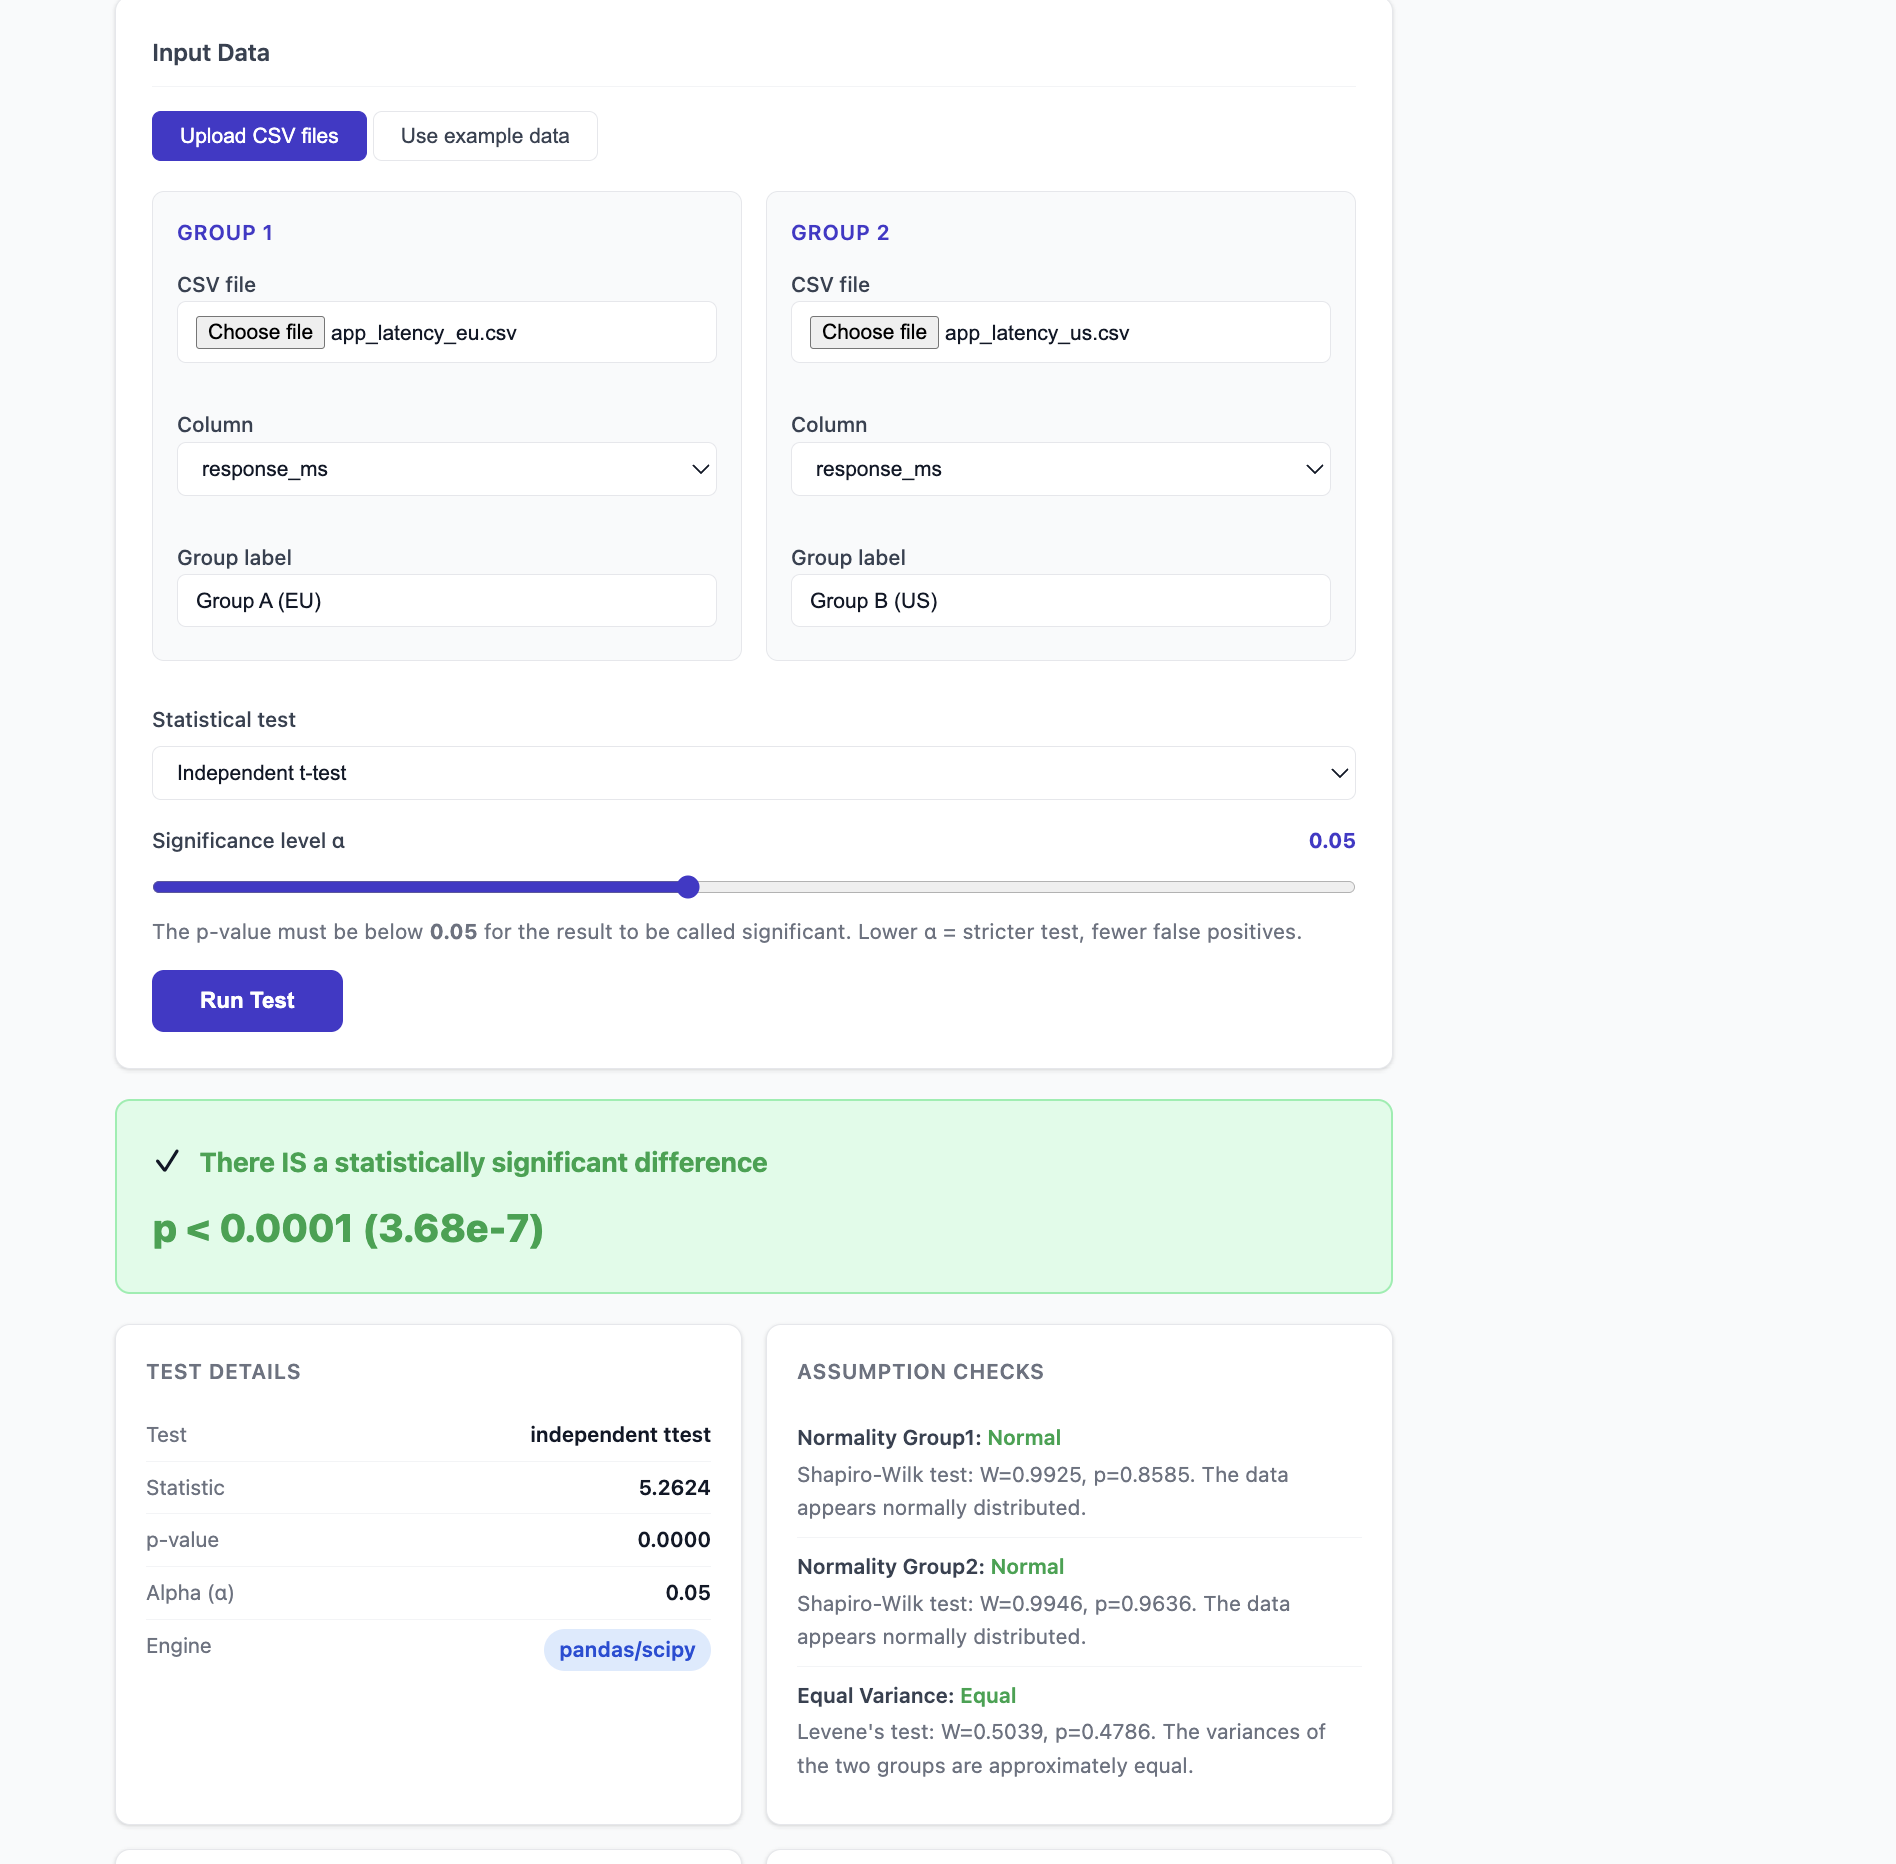
An interactive hypothesis testing tool that translates statistical results into plain English. Upload two CSV columns, select one of five tests, and get a verdict any non-statistician can act on — "There IS a statistically significant difference" or "There IS NOT" — alongside the p-value, test statistic, assumption check results, and a distribution plot.
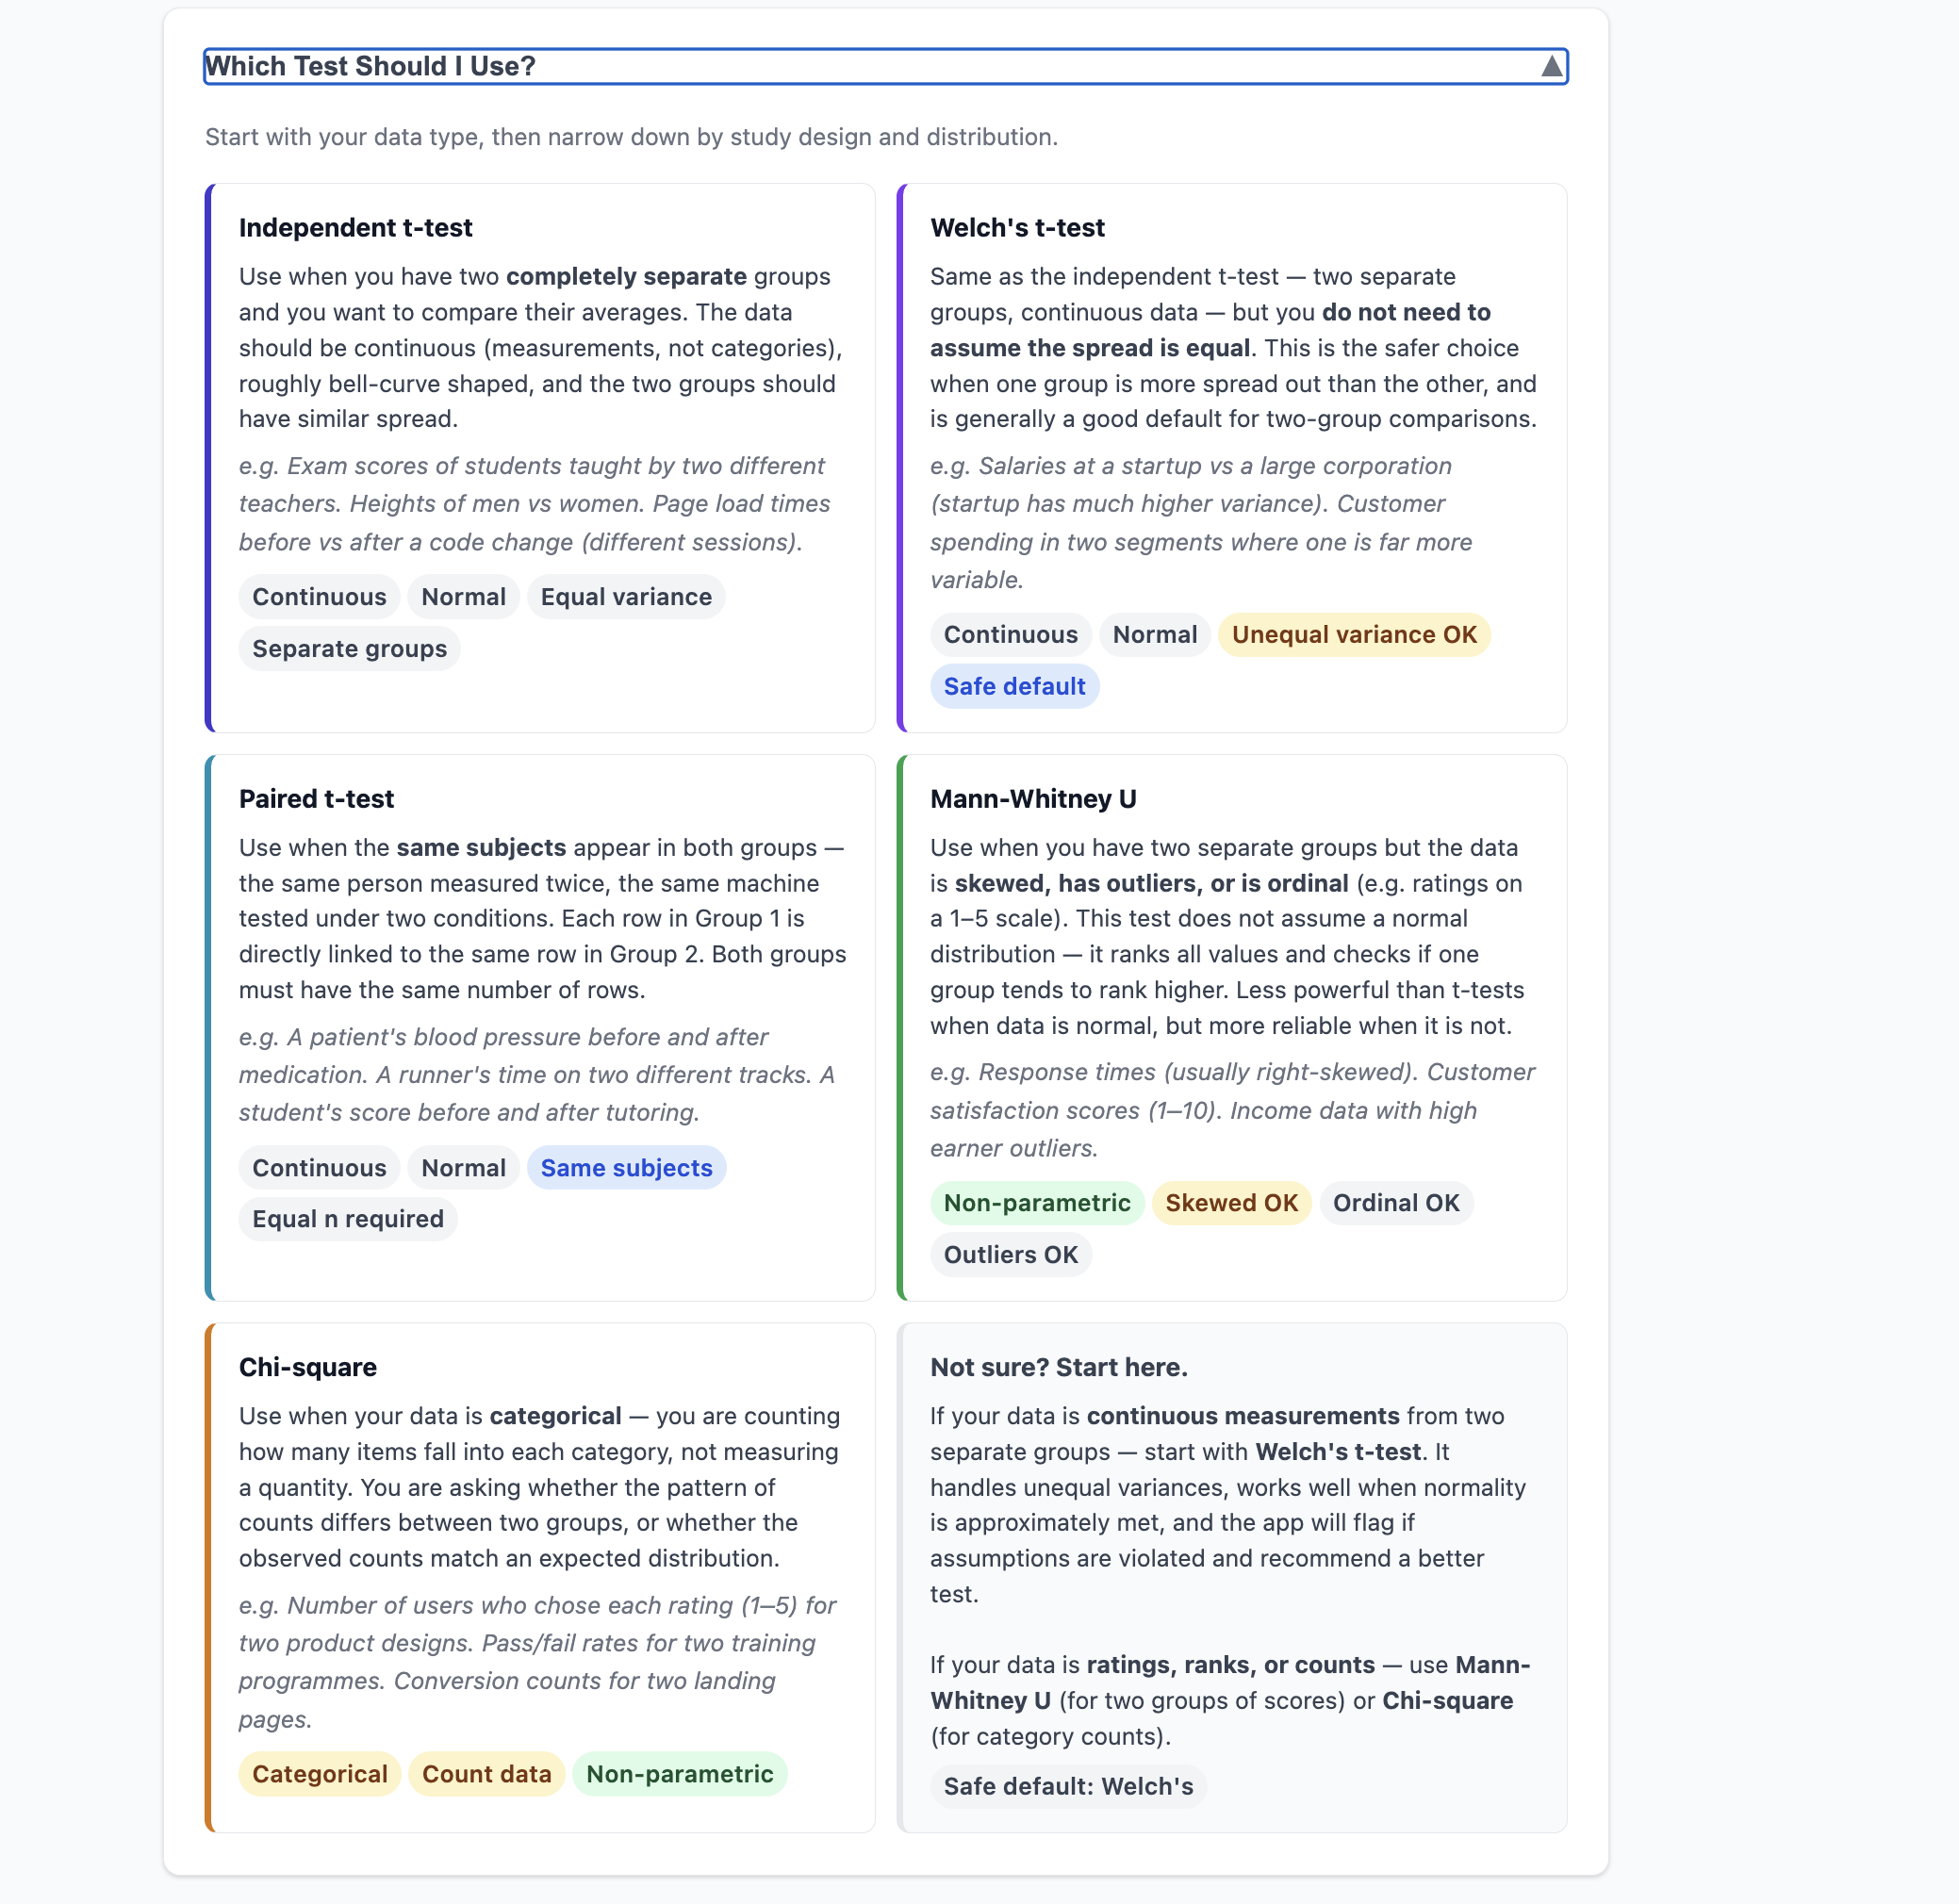
Five tests are supported: independent t-test, Welch's t-test, paired t-test, Mann-Whitney U, and chi-square. Before running any parametric test the app checks normality (Shapiro-Wilk) and equal variance (Levene's test) and recommends an alternative if assumptions are violated.
The routing logic is the portfolio centrepiece: datasets below 50,000 rows use pandas and scipy; above that threshold the computation routes through PySpark in local[*] mode. The statistical question is identical — only the engine changes. PySpark reads the data and computes descriptive statistics across all rows; scipy computes the test statistic on a 10,000-row representative sample. This mirrors the standard production pattern: distributed data preparation, established statistical libraries for the test itself.
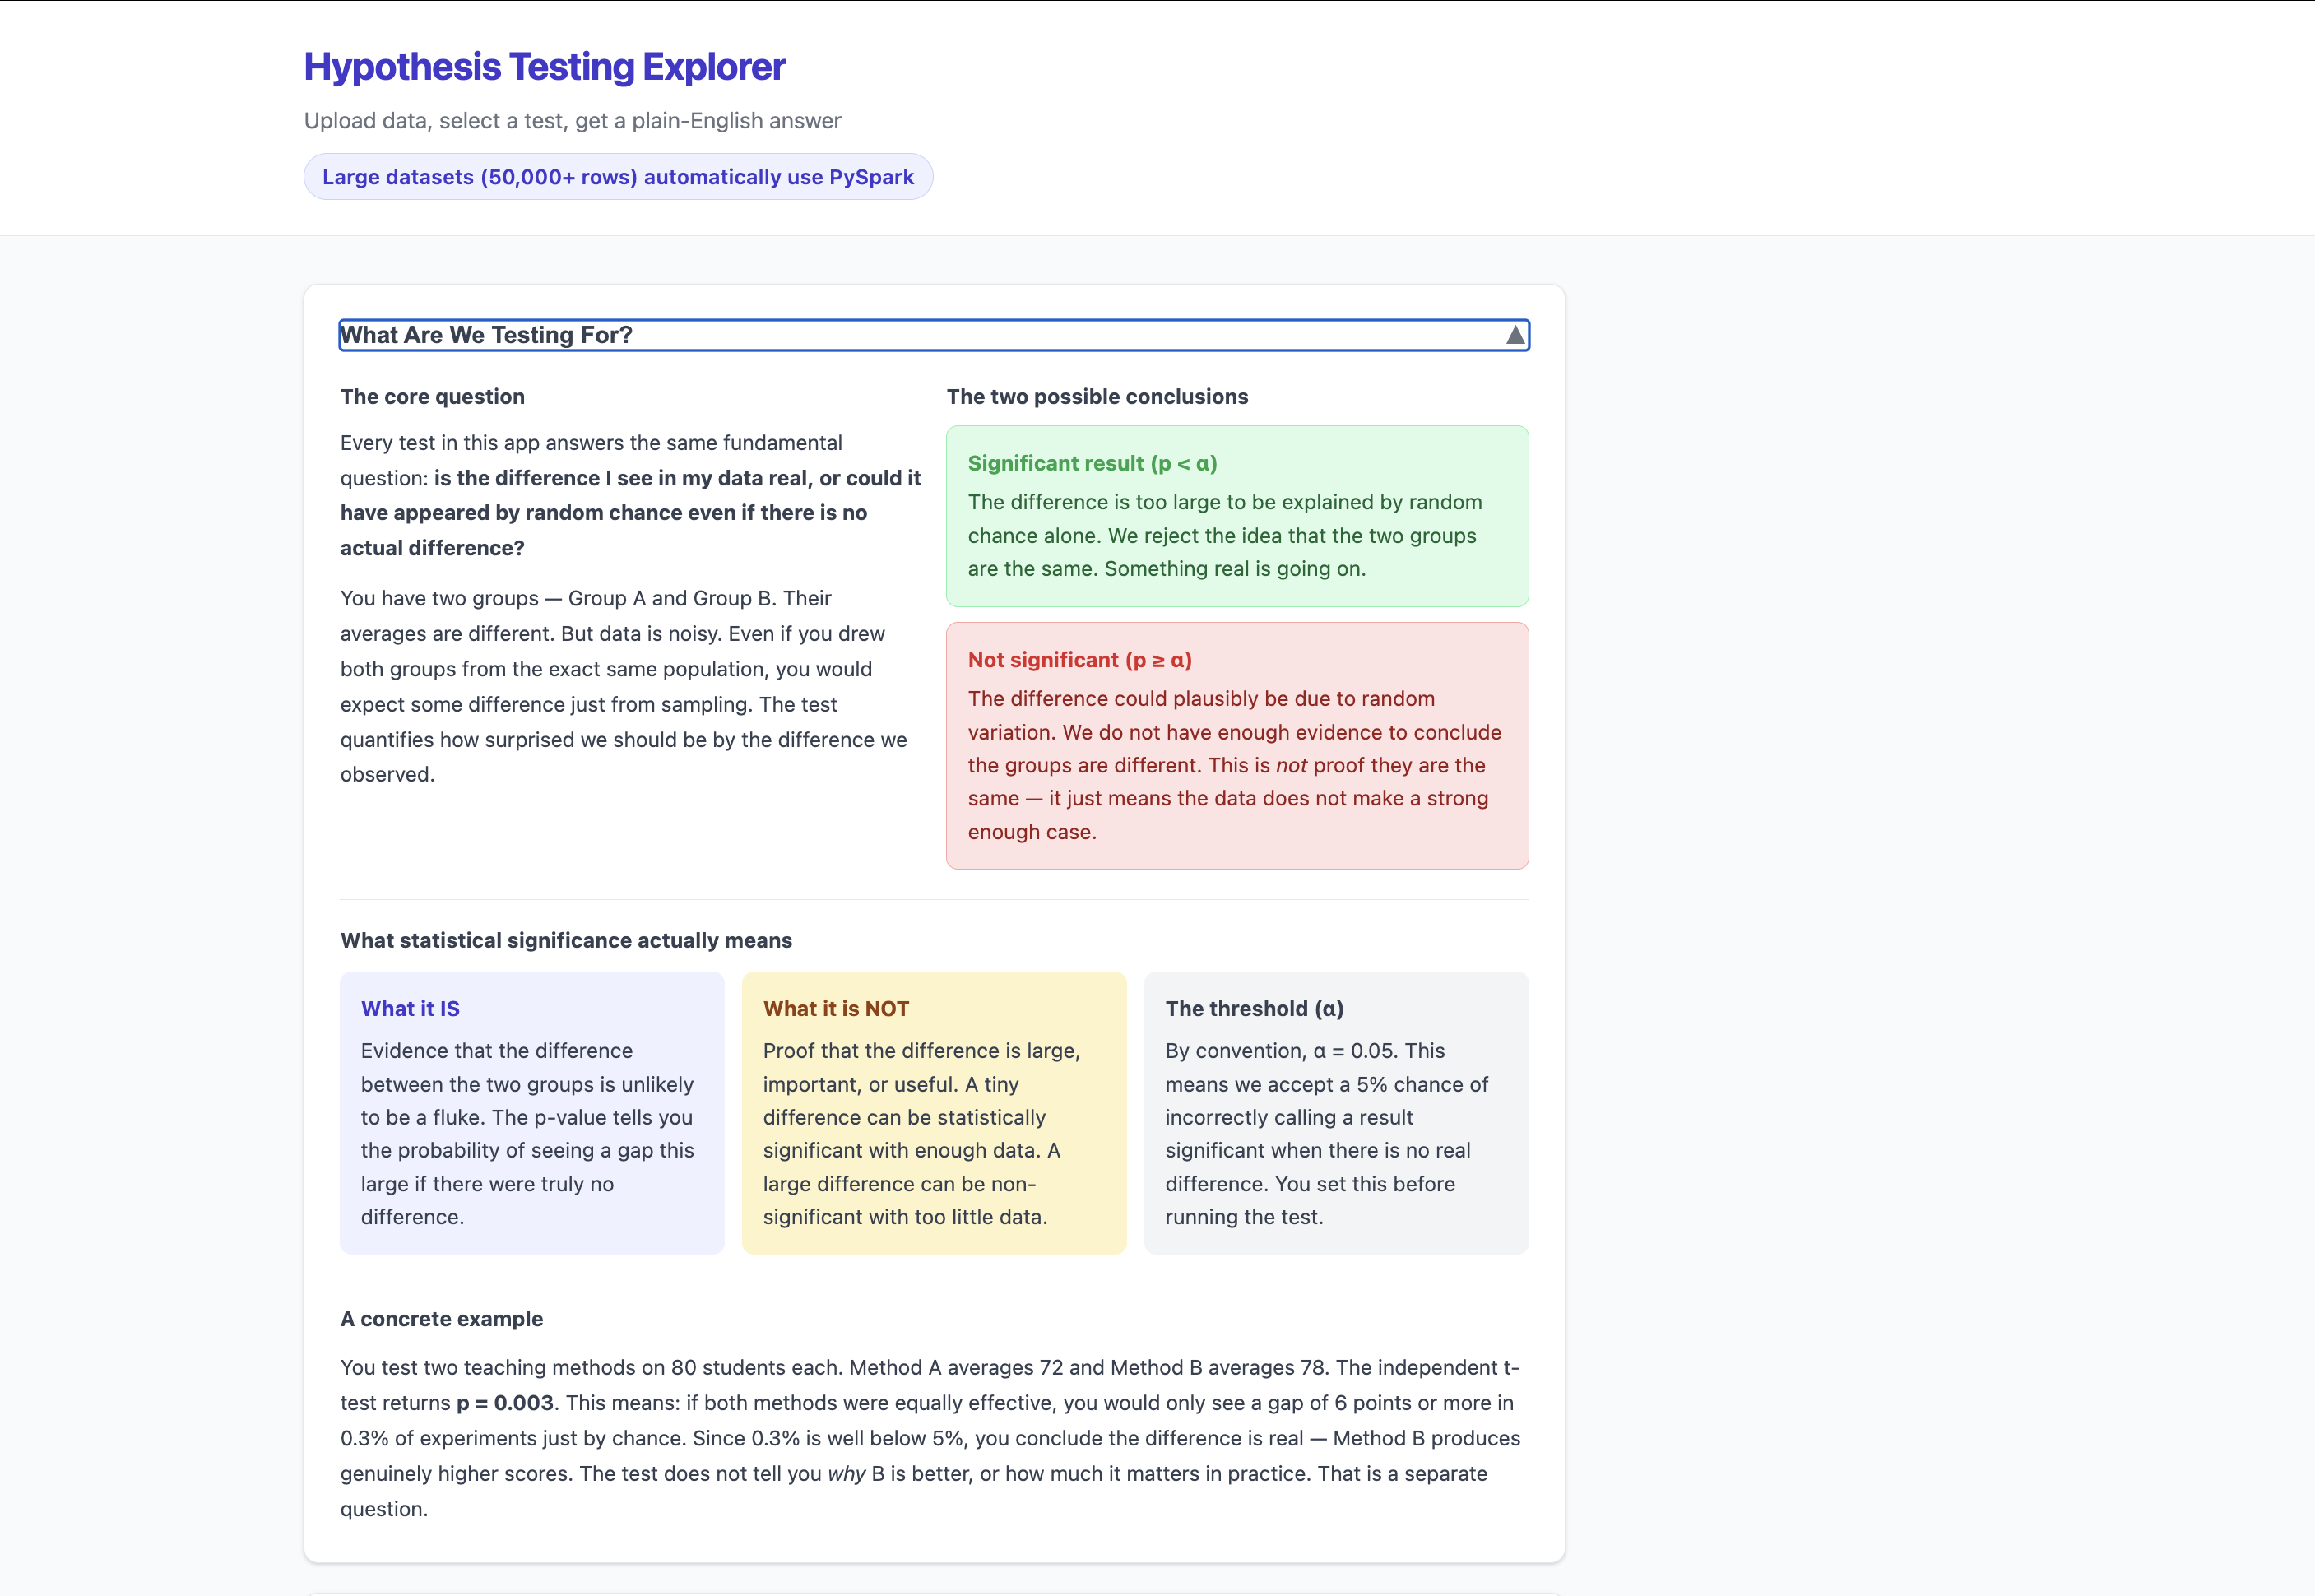
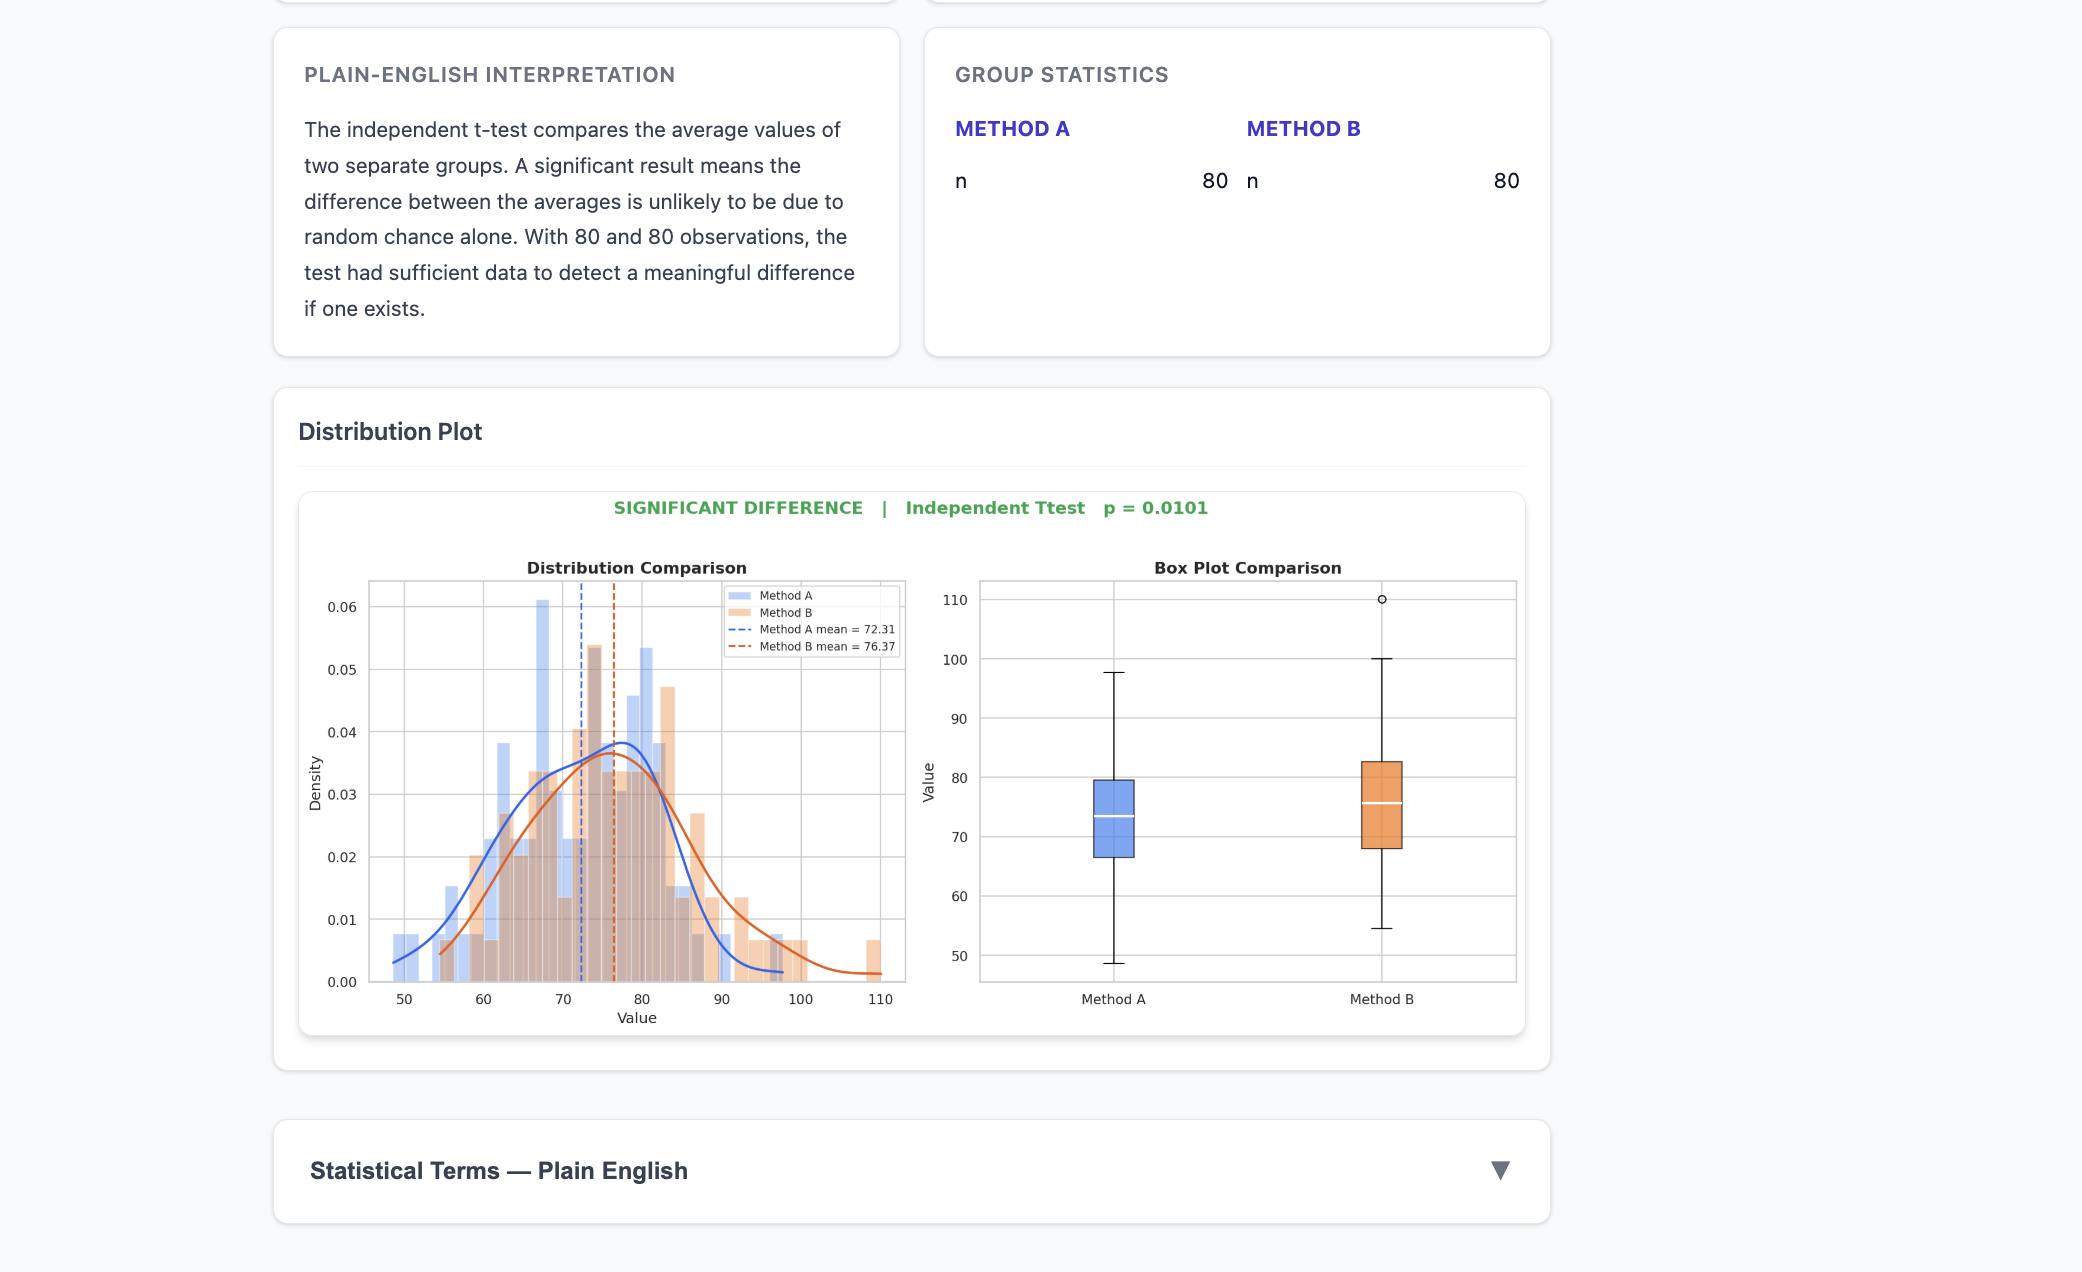
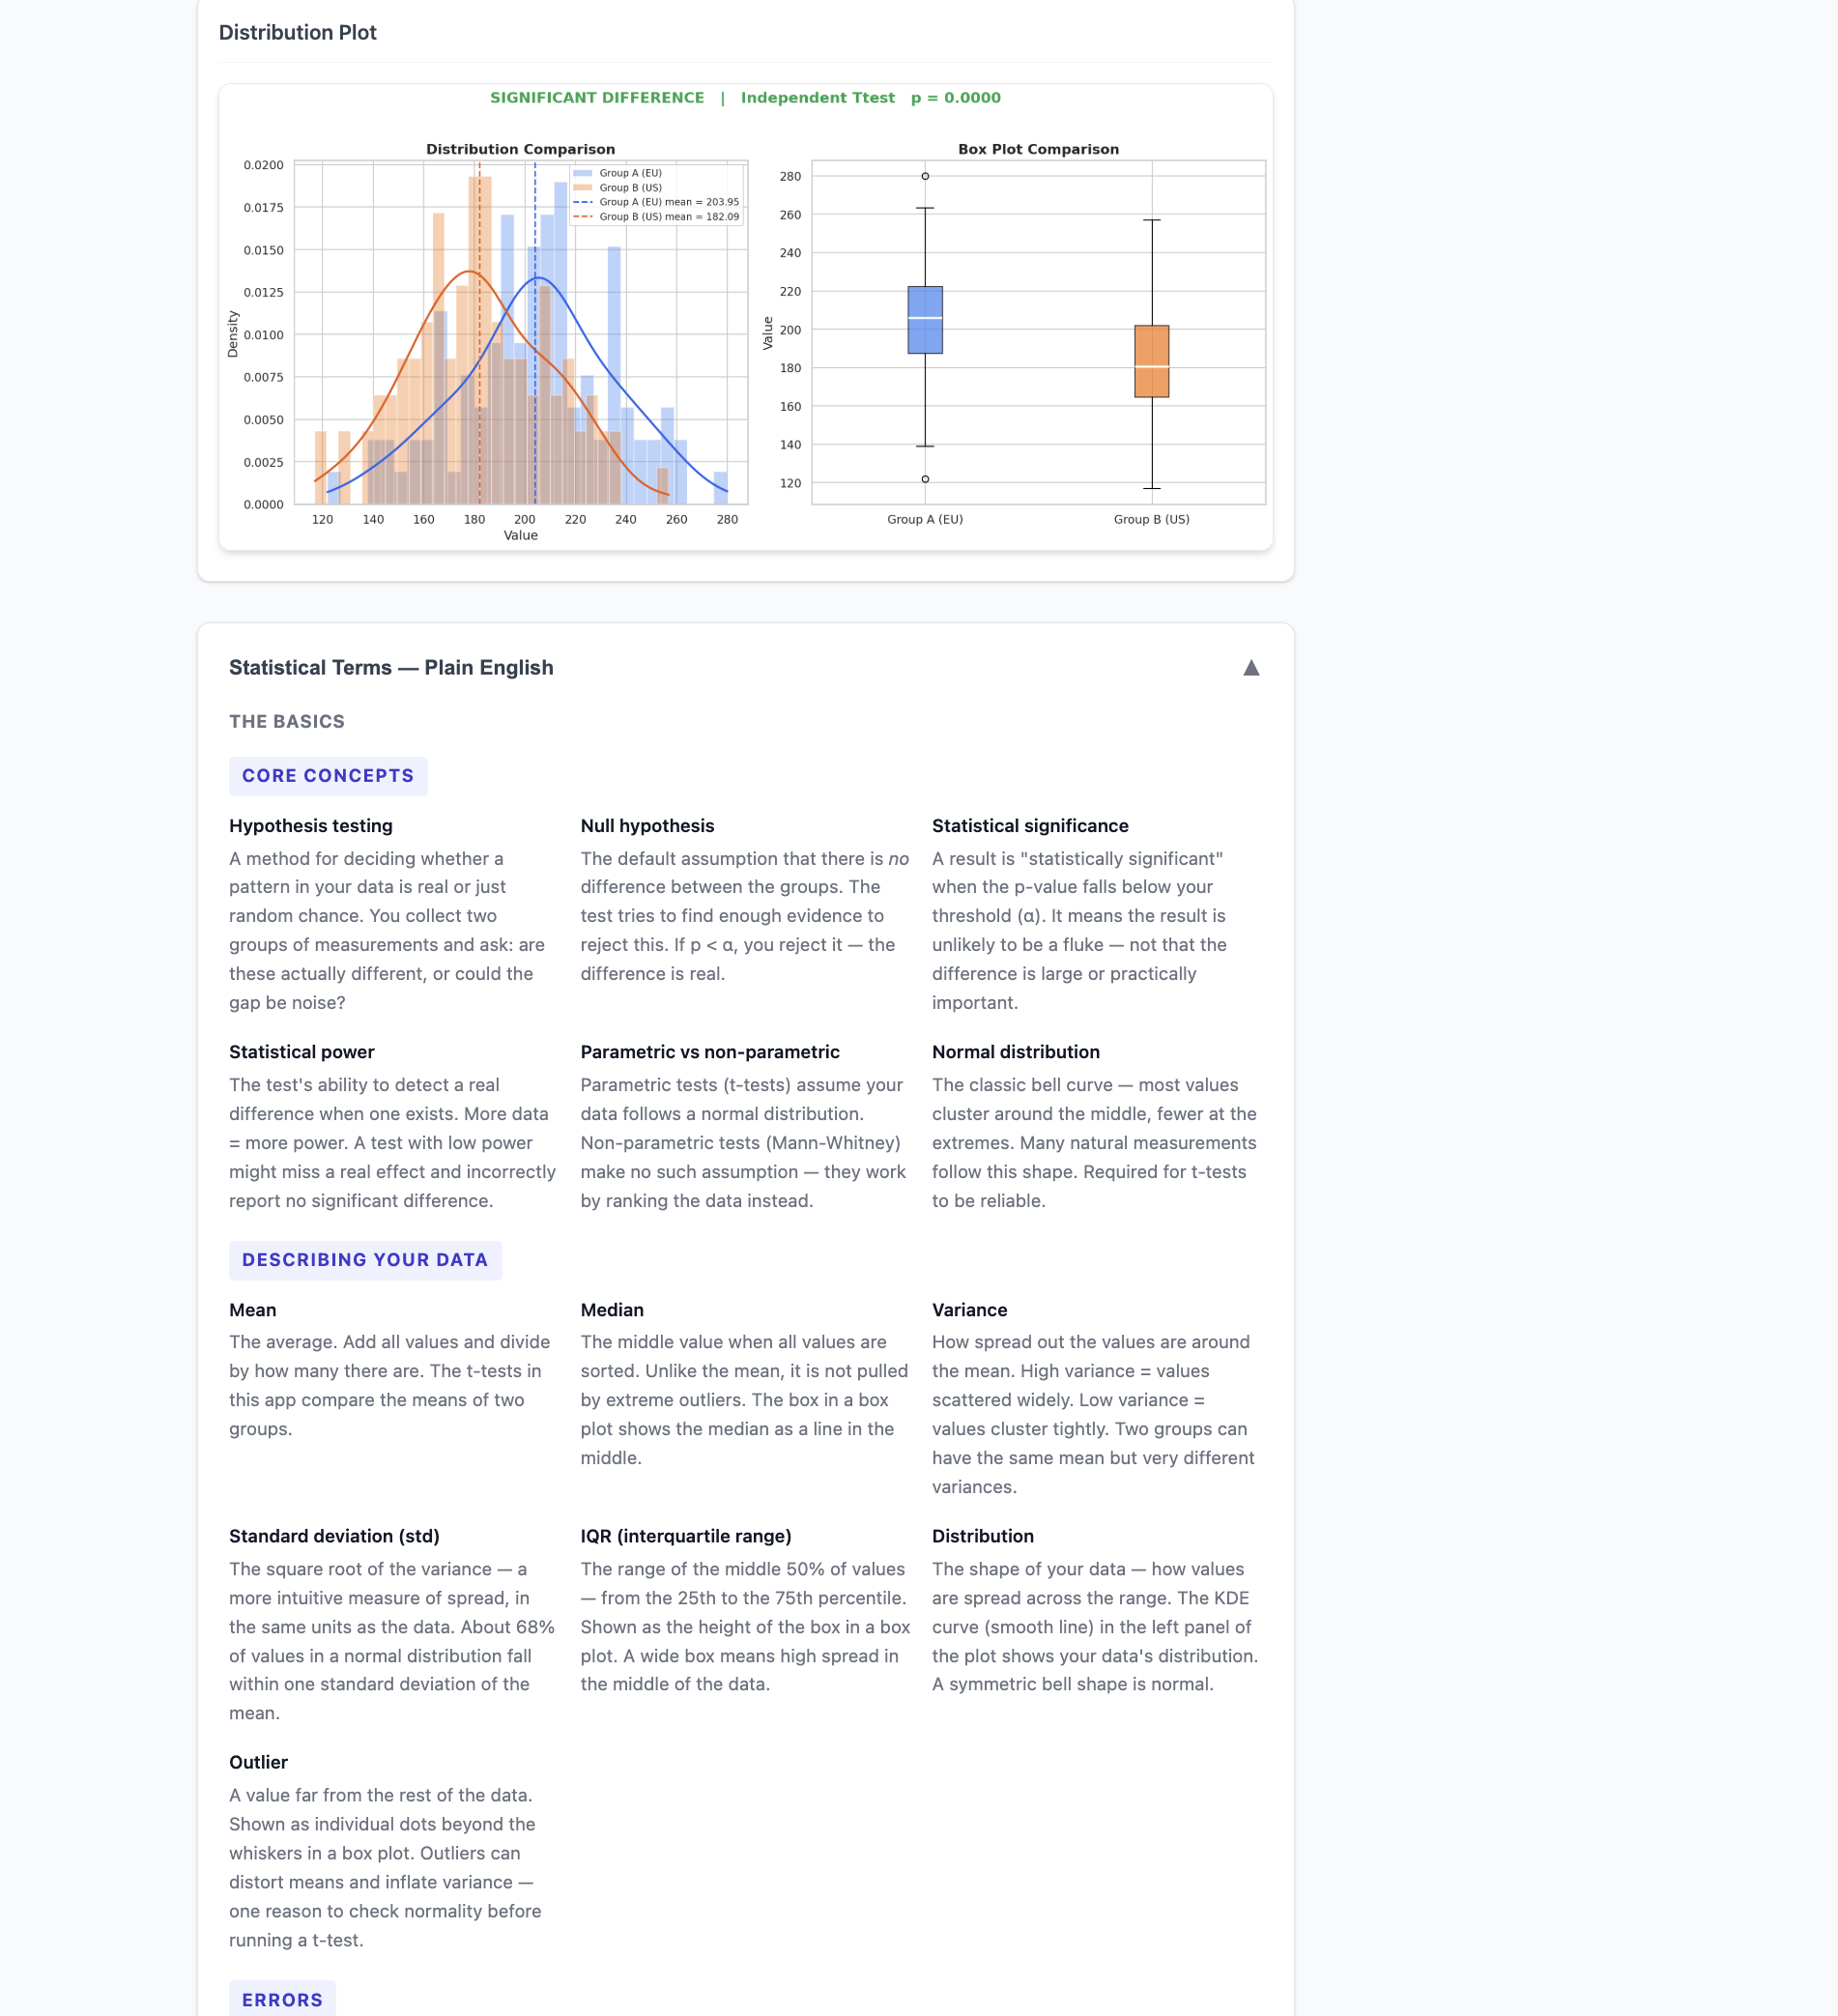
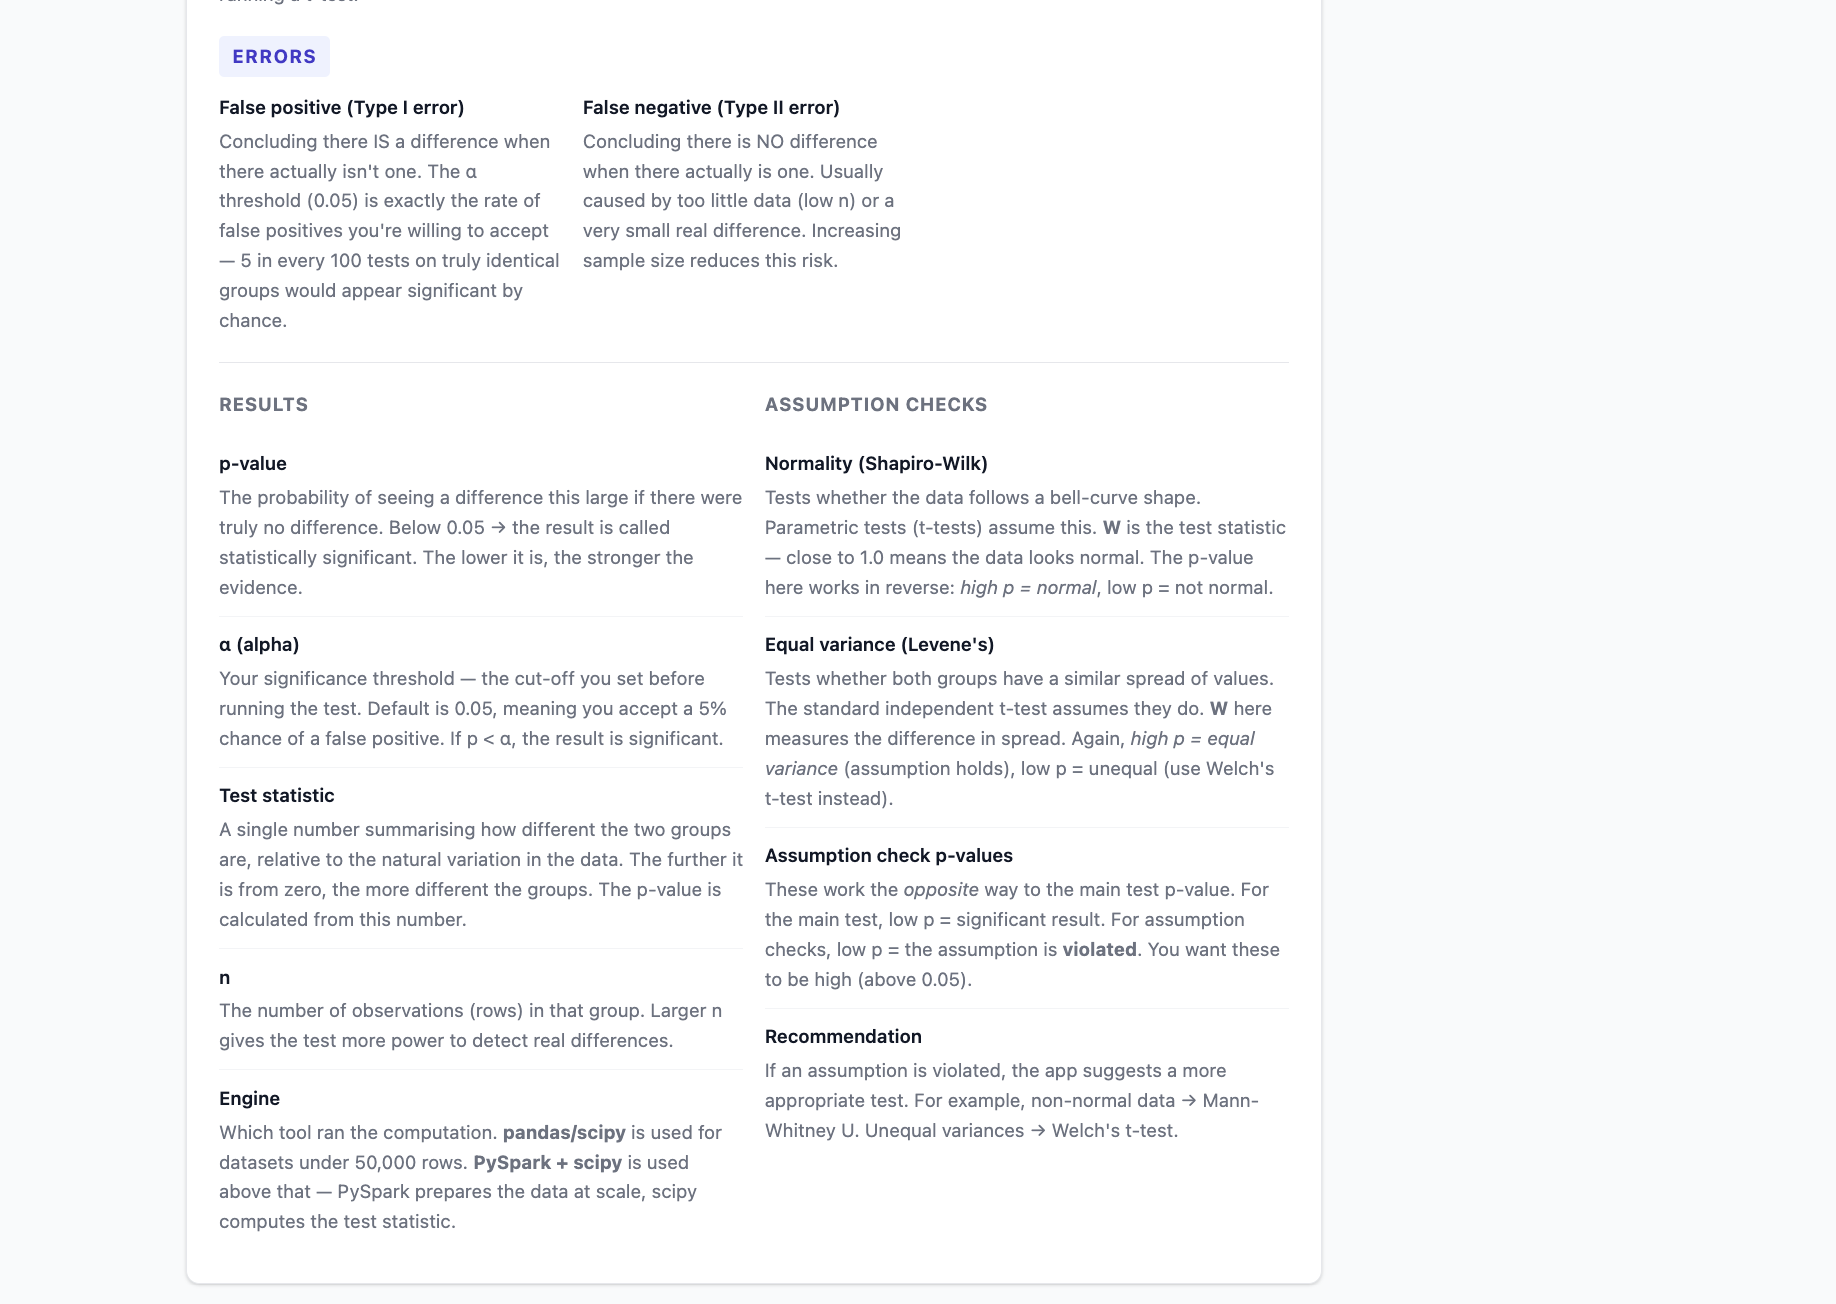
The app accepts CSV file uploads or raw JSON arrays via a REST API. Every result generates a two-panel distribution plot — overlapping KDE curves and histograms on the left, side-by-side box plots on the right. The frontend includes a plain-English glossary covering 25 statistical terms, a "Which test should I use?" decision guide for all five tests, and a "What are we testing for?" primer on hypothesis testing fundamentals. Deployed on Hugging Face Spaces via Docker with Java pre-installed in the image for PySpark.
Quick Facts
Overview
Problem
Statistics tools typically return raw numbers — p-values, test statistics, confidence intervals — and leave interpretation to the user. For non-statisticians this creates a gap between running an analysis and knowing what to do with the result.
Most Python data science portfolios demonstrate either pandas/scipy or PySpark, rarely both on the same problem. The goal was to close both gaps: translate statistical output into plain-English conclusions a non-statistician can act on, and demonstrate that the same statistical question can be answered at any data scale by choosing the right computational tool.
Solution
The plain-English verdict is generated from the p-value and alpha threshold using consistent sentence templates so the conclusion is always unambiguous. Assumption checking runs automatically before every parametric test and surfaces recommendations when violated — mirroring what a careful statistician does before reporting results.
The 50,000-row routing threshold is documented in config.py and in the UI: below it, Spark's JVM initialisation overhead makes pandas faster; above it, Spark's parallelism across all CPU cores pays off. PySpark handles all data ingestion and descriptive statistics; scipy handles the test statistic on a sampled subset — an honest split that reflects how production pipelines actually work.
The app is served via FastAPI, containerised with Docker (Java installed via apt-get for PySpark), and deployed on Hugging Face Spaces with a GitHub Actions CI pipeline running pytest on every push.
Challenges
PySpark requires Java, which adds ~200MB to the Docker image and must be explicitly installed via apt-get in both the Dockerfile and the GitHub Actions CI workflow — a step that is easy to miss and produces a cryptic runtime error if skipped.
Pydantic v2 changed how nullable fields are validated — fields typed as str with a default of None fail validation when None is returned. All nullable fields required explicit str | None = None type hints. scipy returns numpy.bool_ from comparison operations, which Pydantic v2 cannot serialise — every significant = p < alpha comparison required an explicit bool() cast.
Chi-square with continuous data fails because observed and expected frequency sums must match exactly. Fixed by auto-binning both groups into shared histogram bins and using chi2_contingency on the resulting contingency table.
Results / Metrics
TBD — populate after live testing. Record verdicts and p-values for all five built-in example datasets: exam scores (independent t-test), sales by region (Welch's), blood pressure before/after (paired t-test), API response times (Mann-Whitney), and product ratings (chi-square).
Screenshots
Click to enlarge.
Click to enlarge.