Programming Language Workforce Strategy — Data Analysis
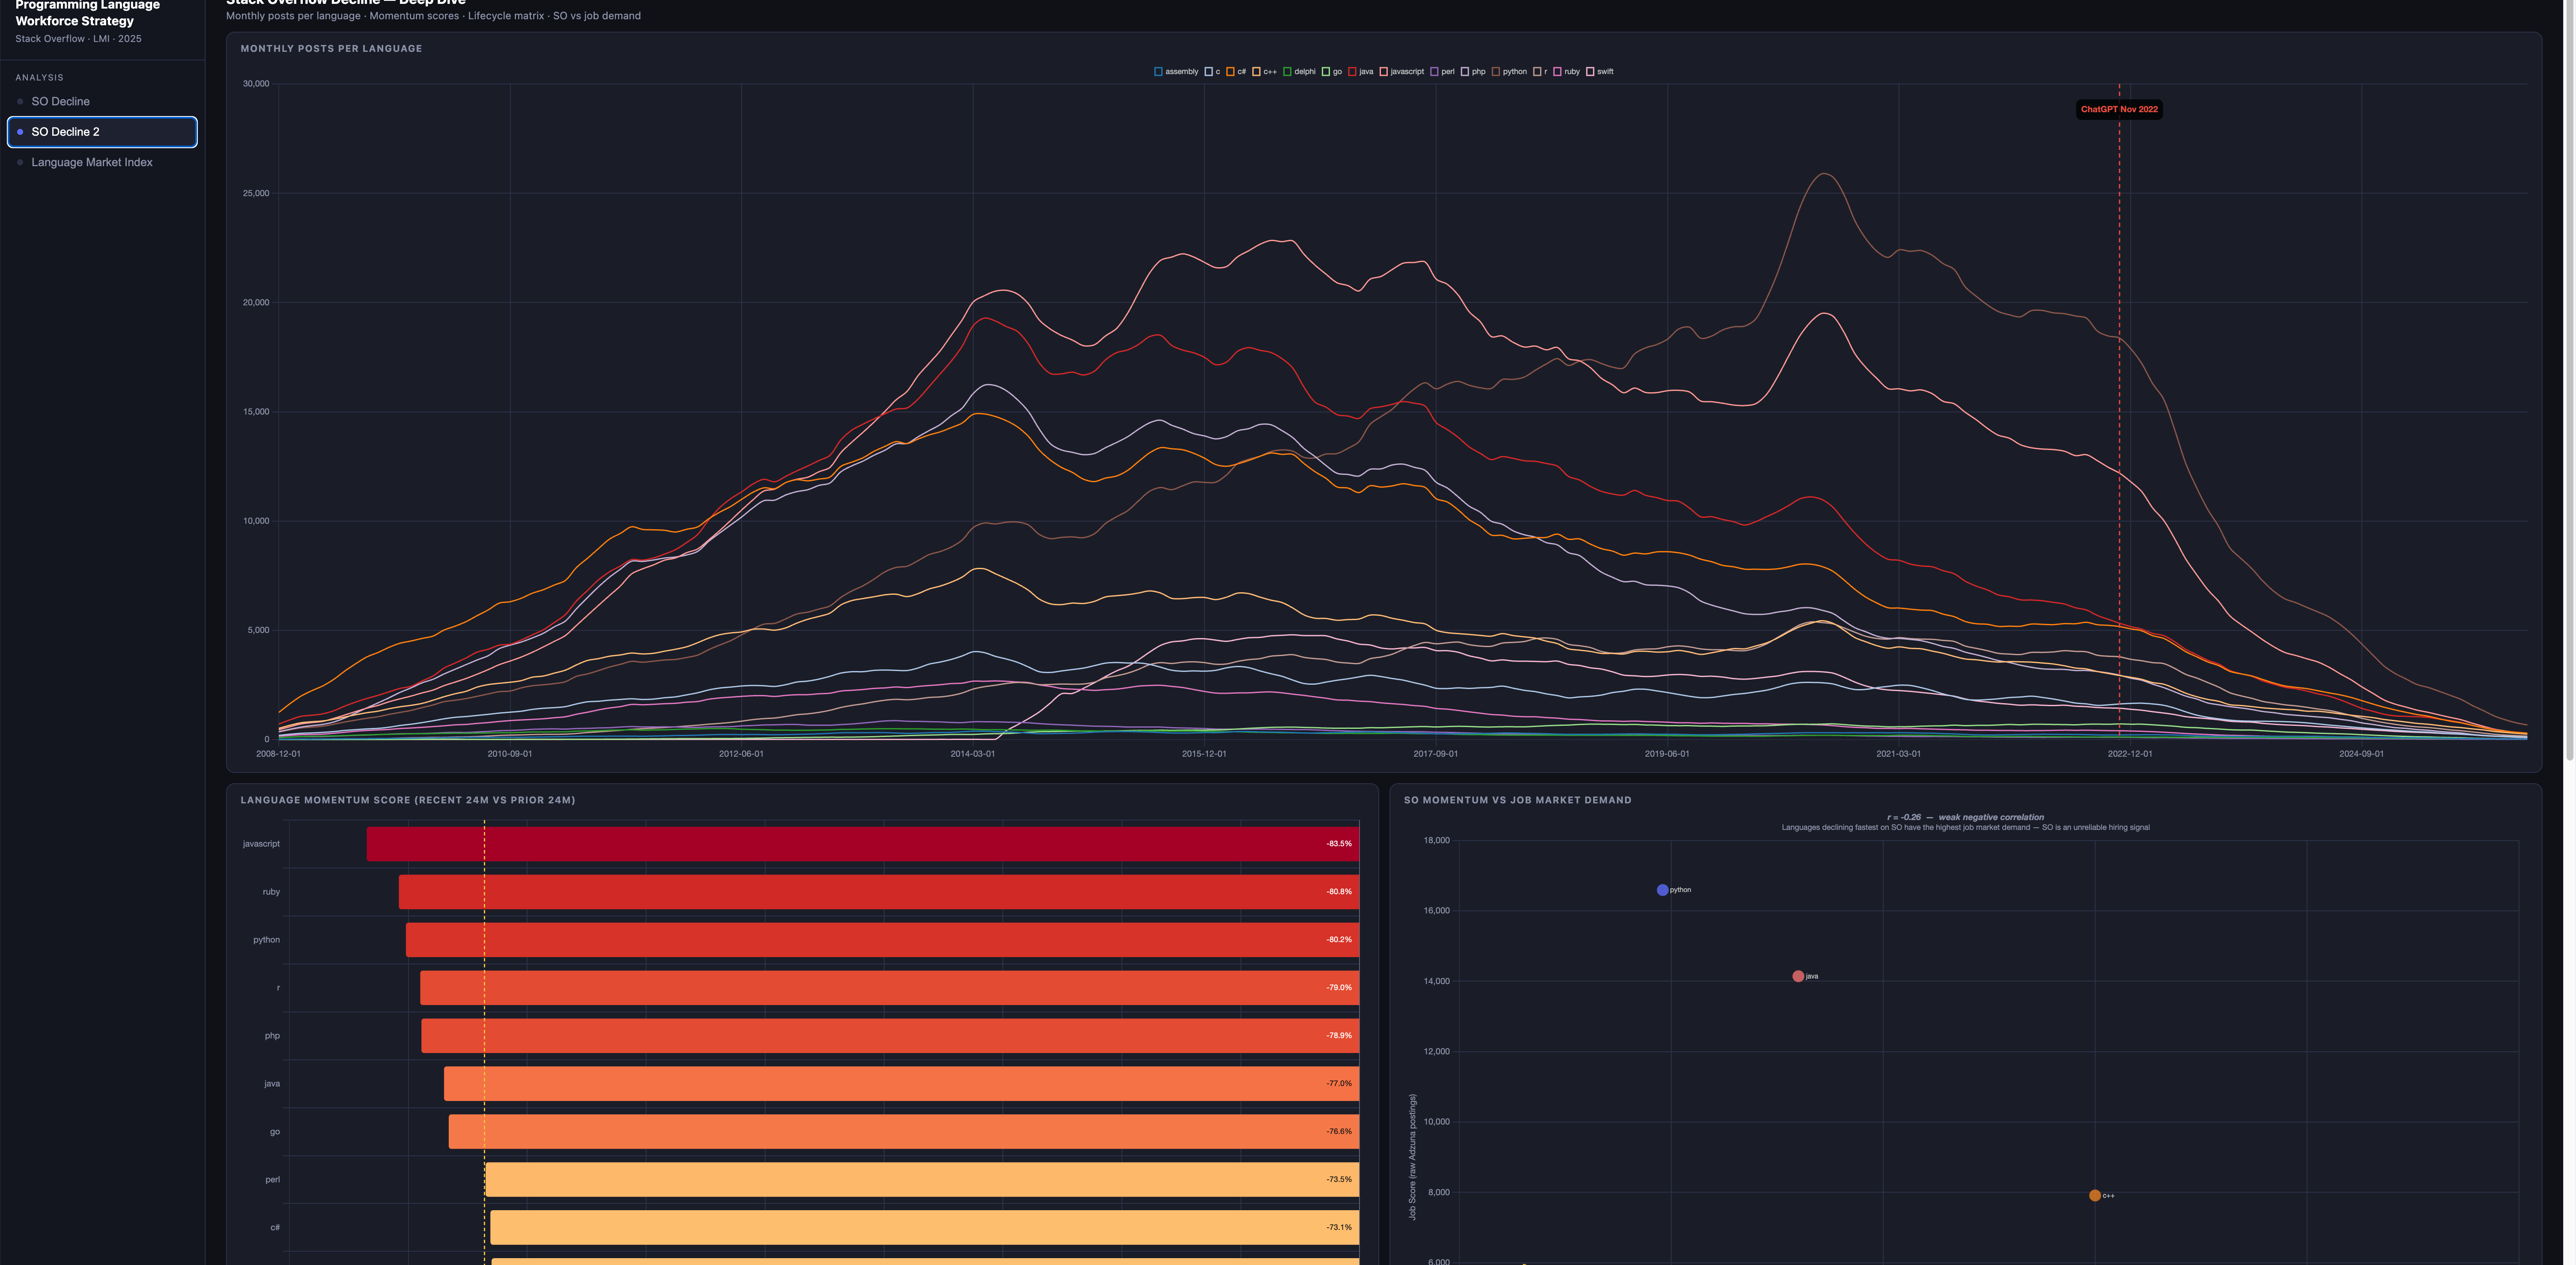
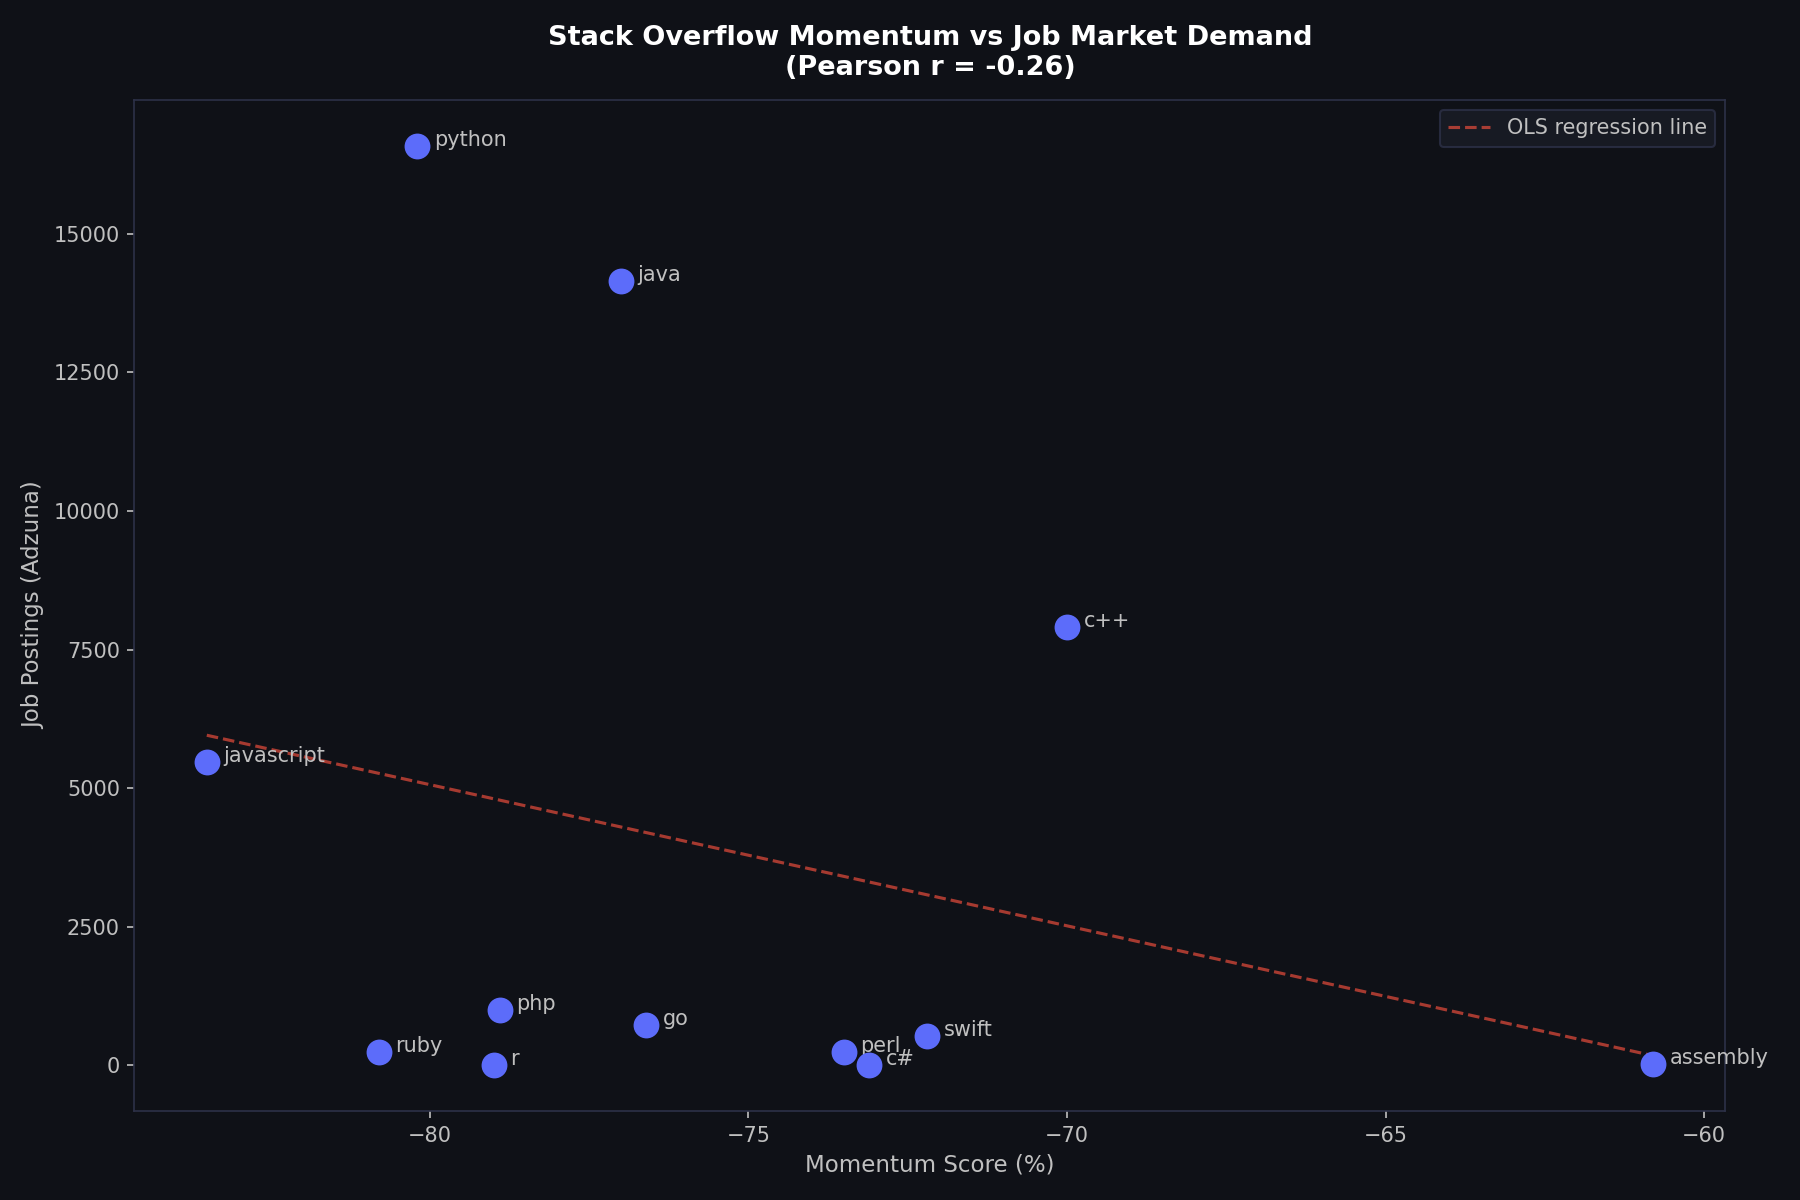
Stack Overflow was the de facto measure of developer activity for over a decade. But by December 2025 it had lost 97.7% of its peak post volume — and a Pearson correlation of −0.26 between SO momentum and job market demand reveals something worse than noise: the signal is inverted. Languages declining fastest on SO are the ones employers are most actively hiring for. Any workforce strategy built on raw SO counts points in the wrong direction.
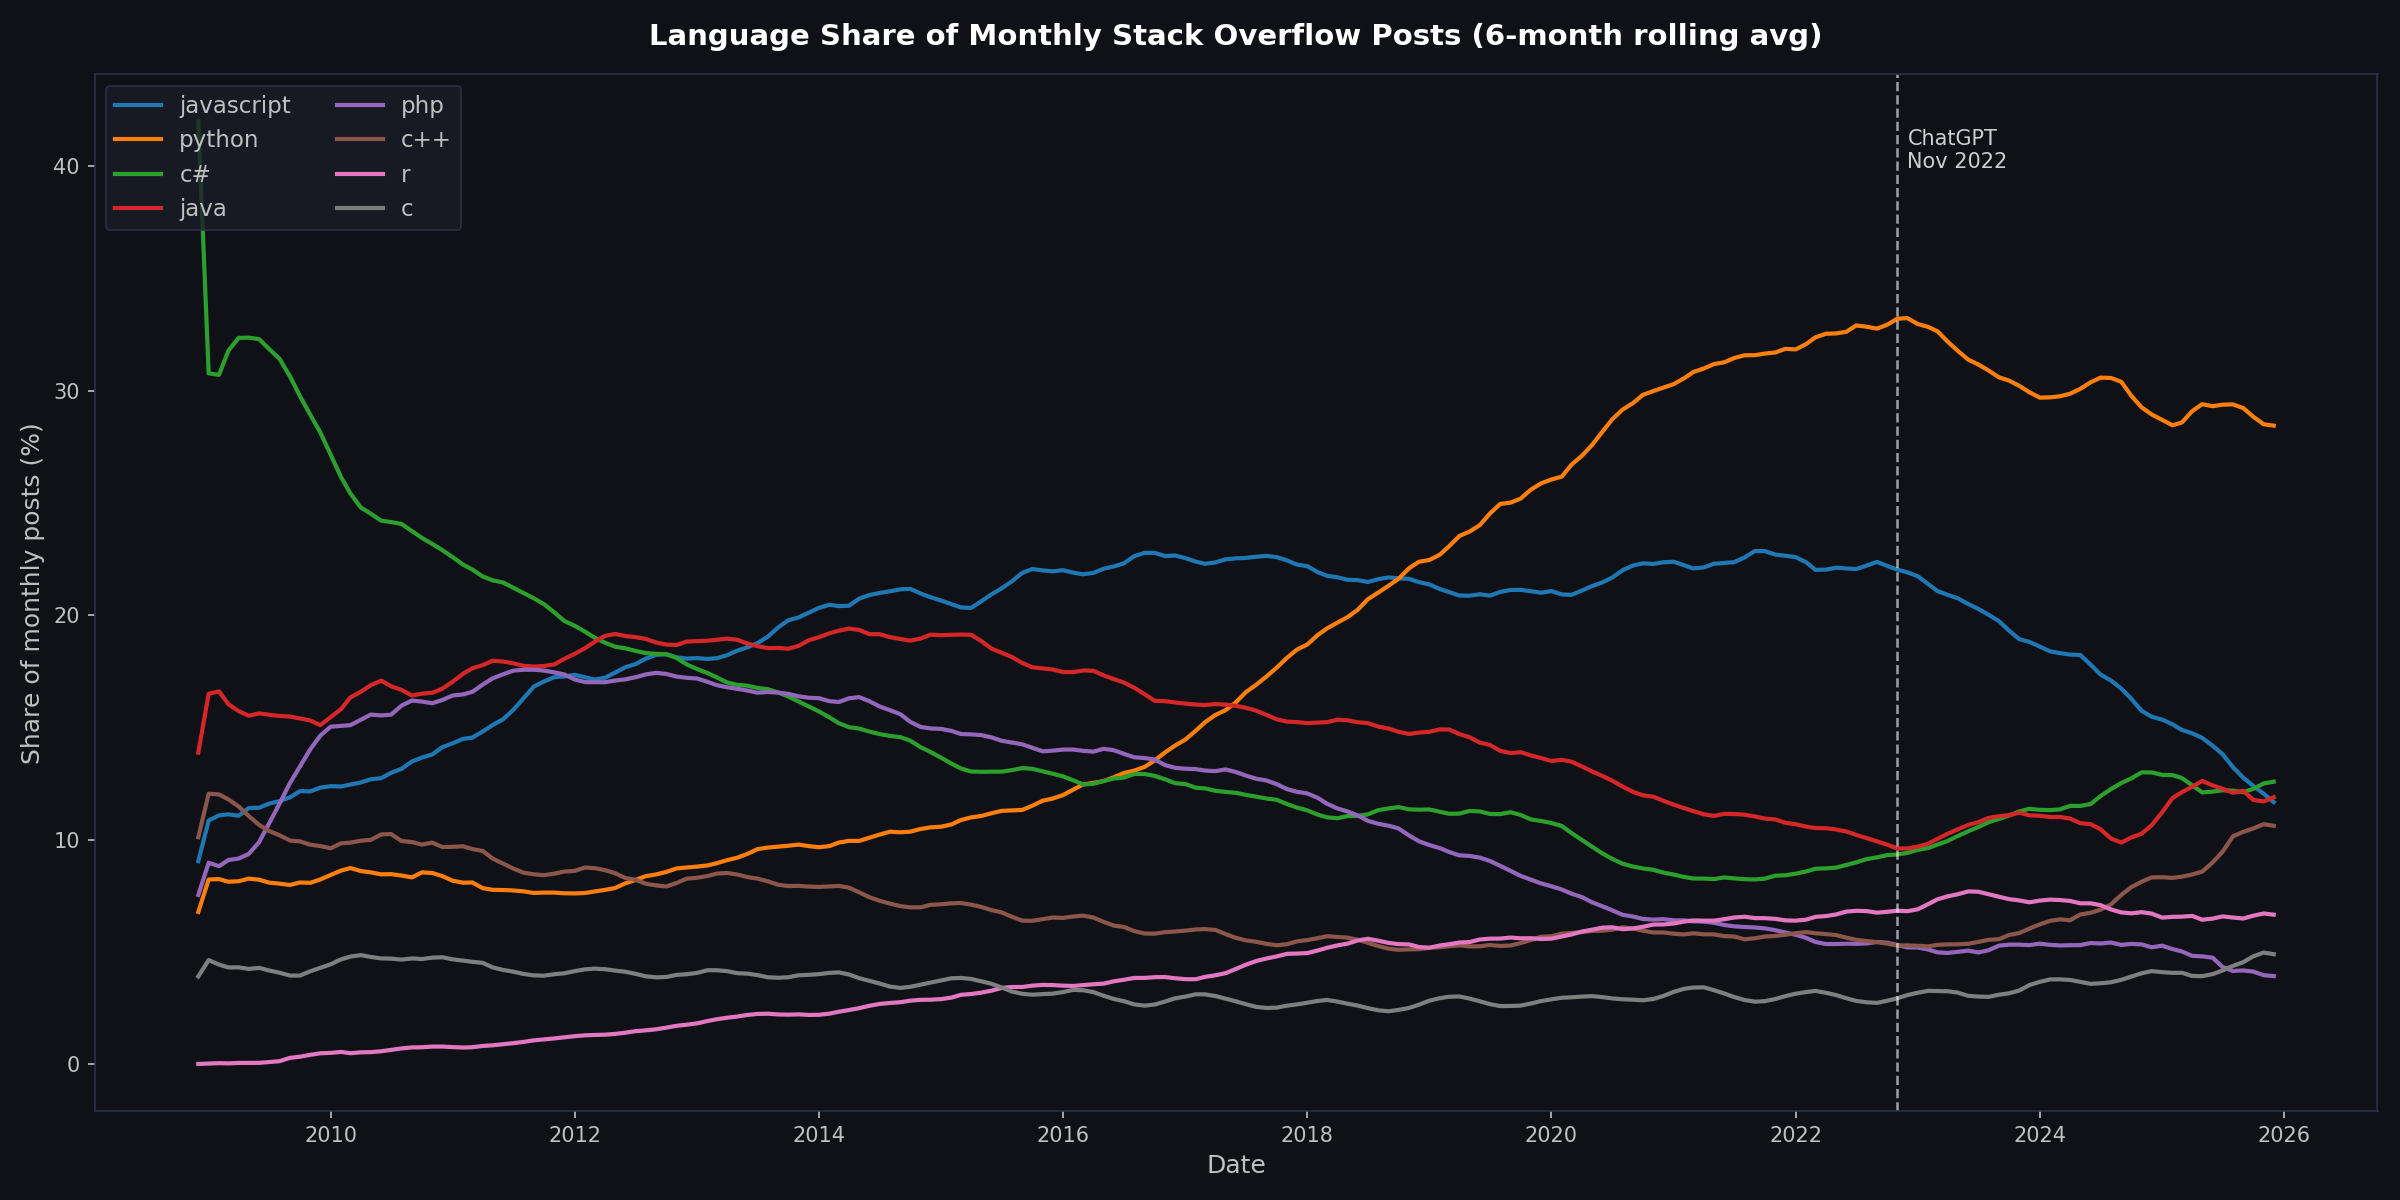
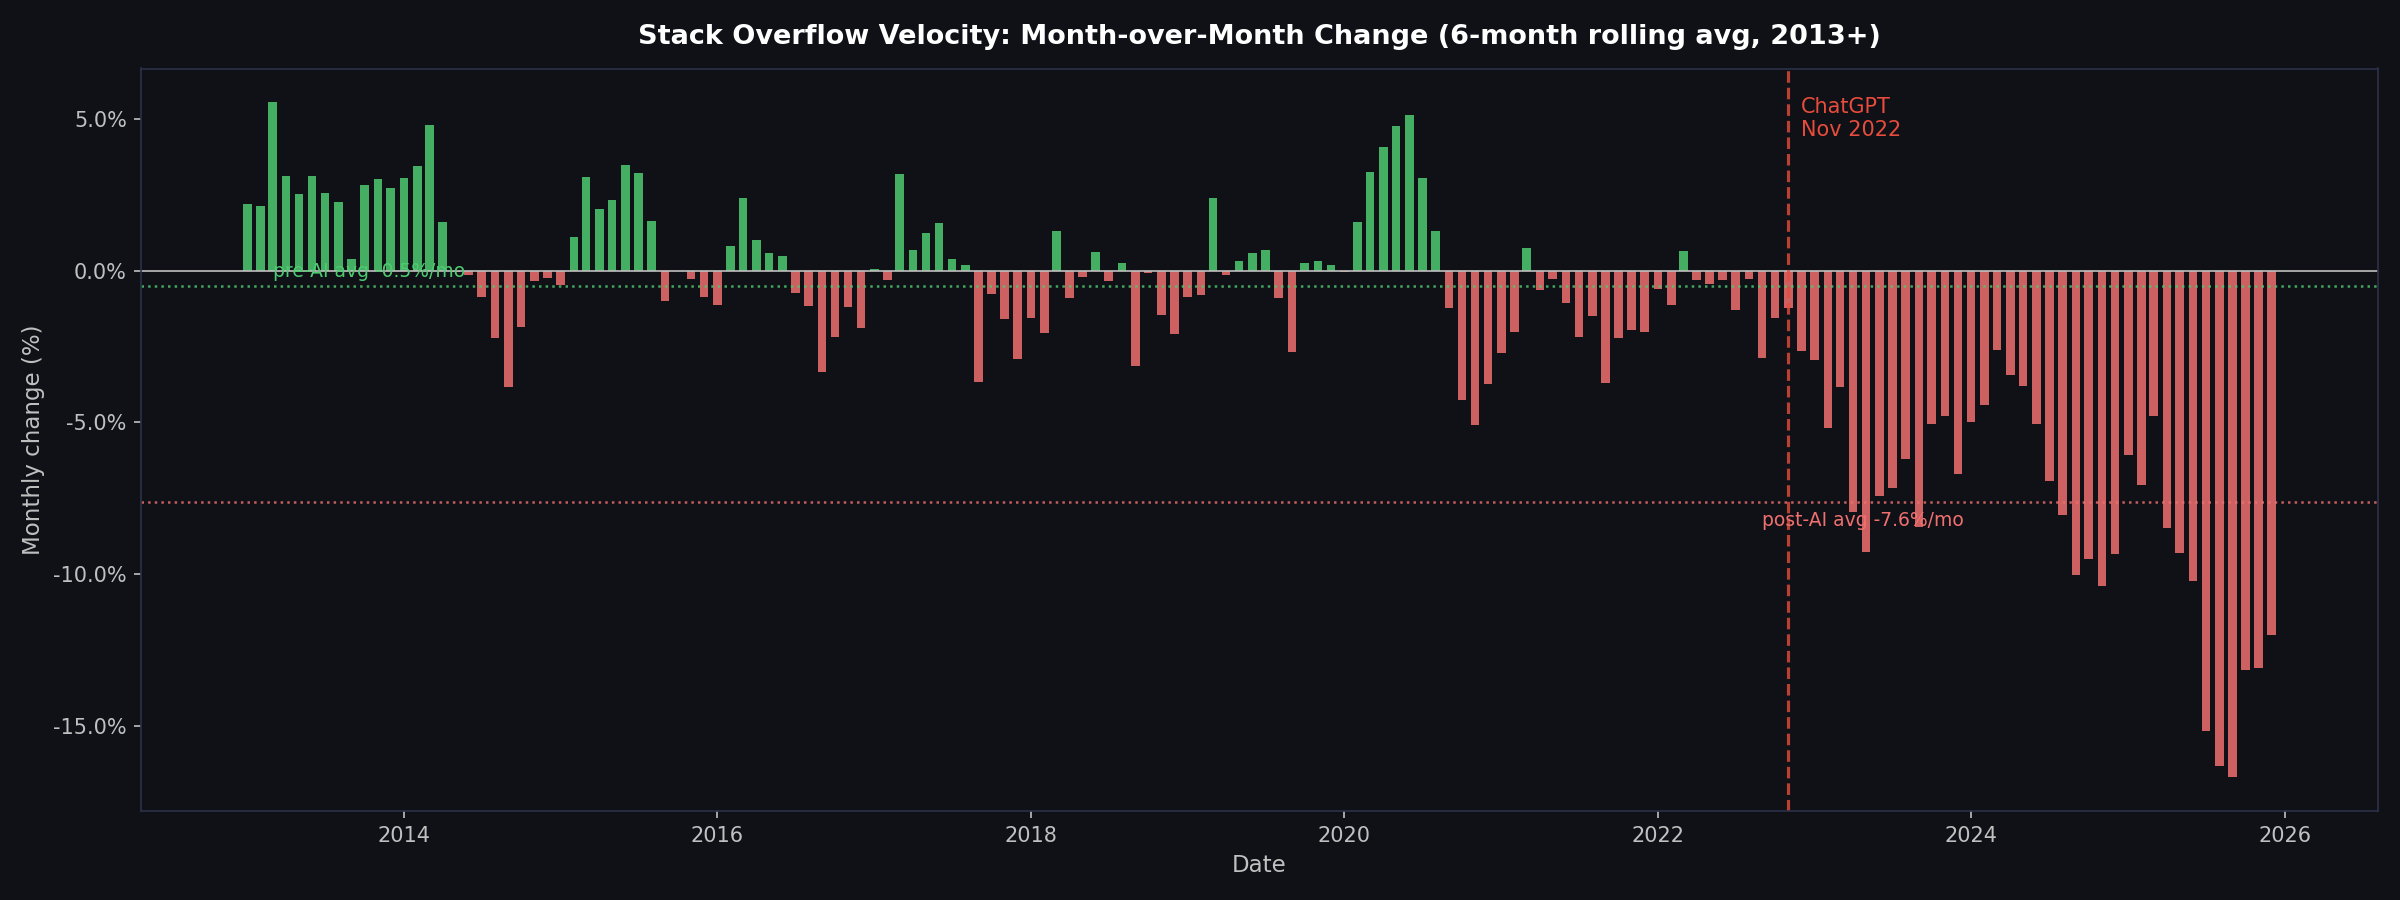
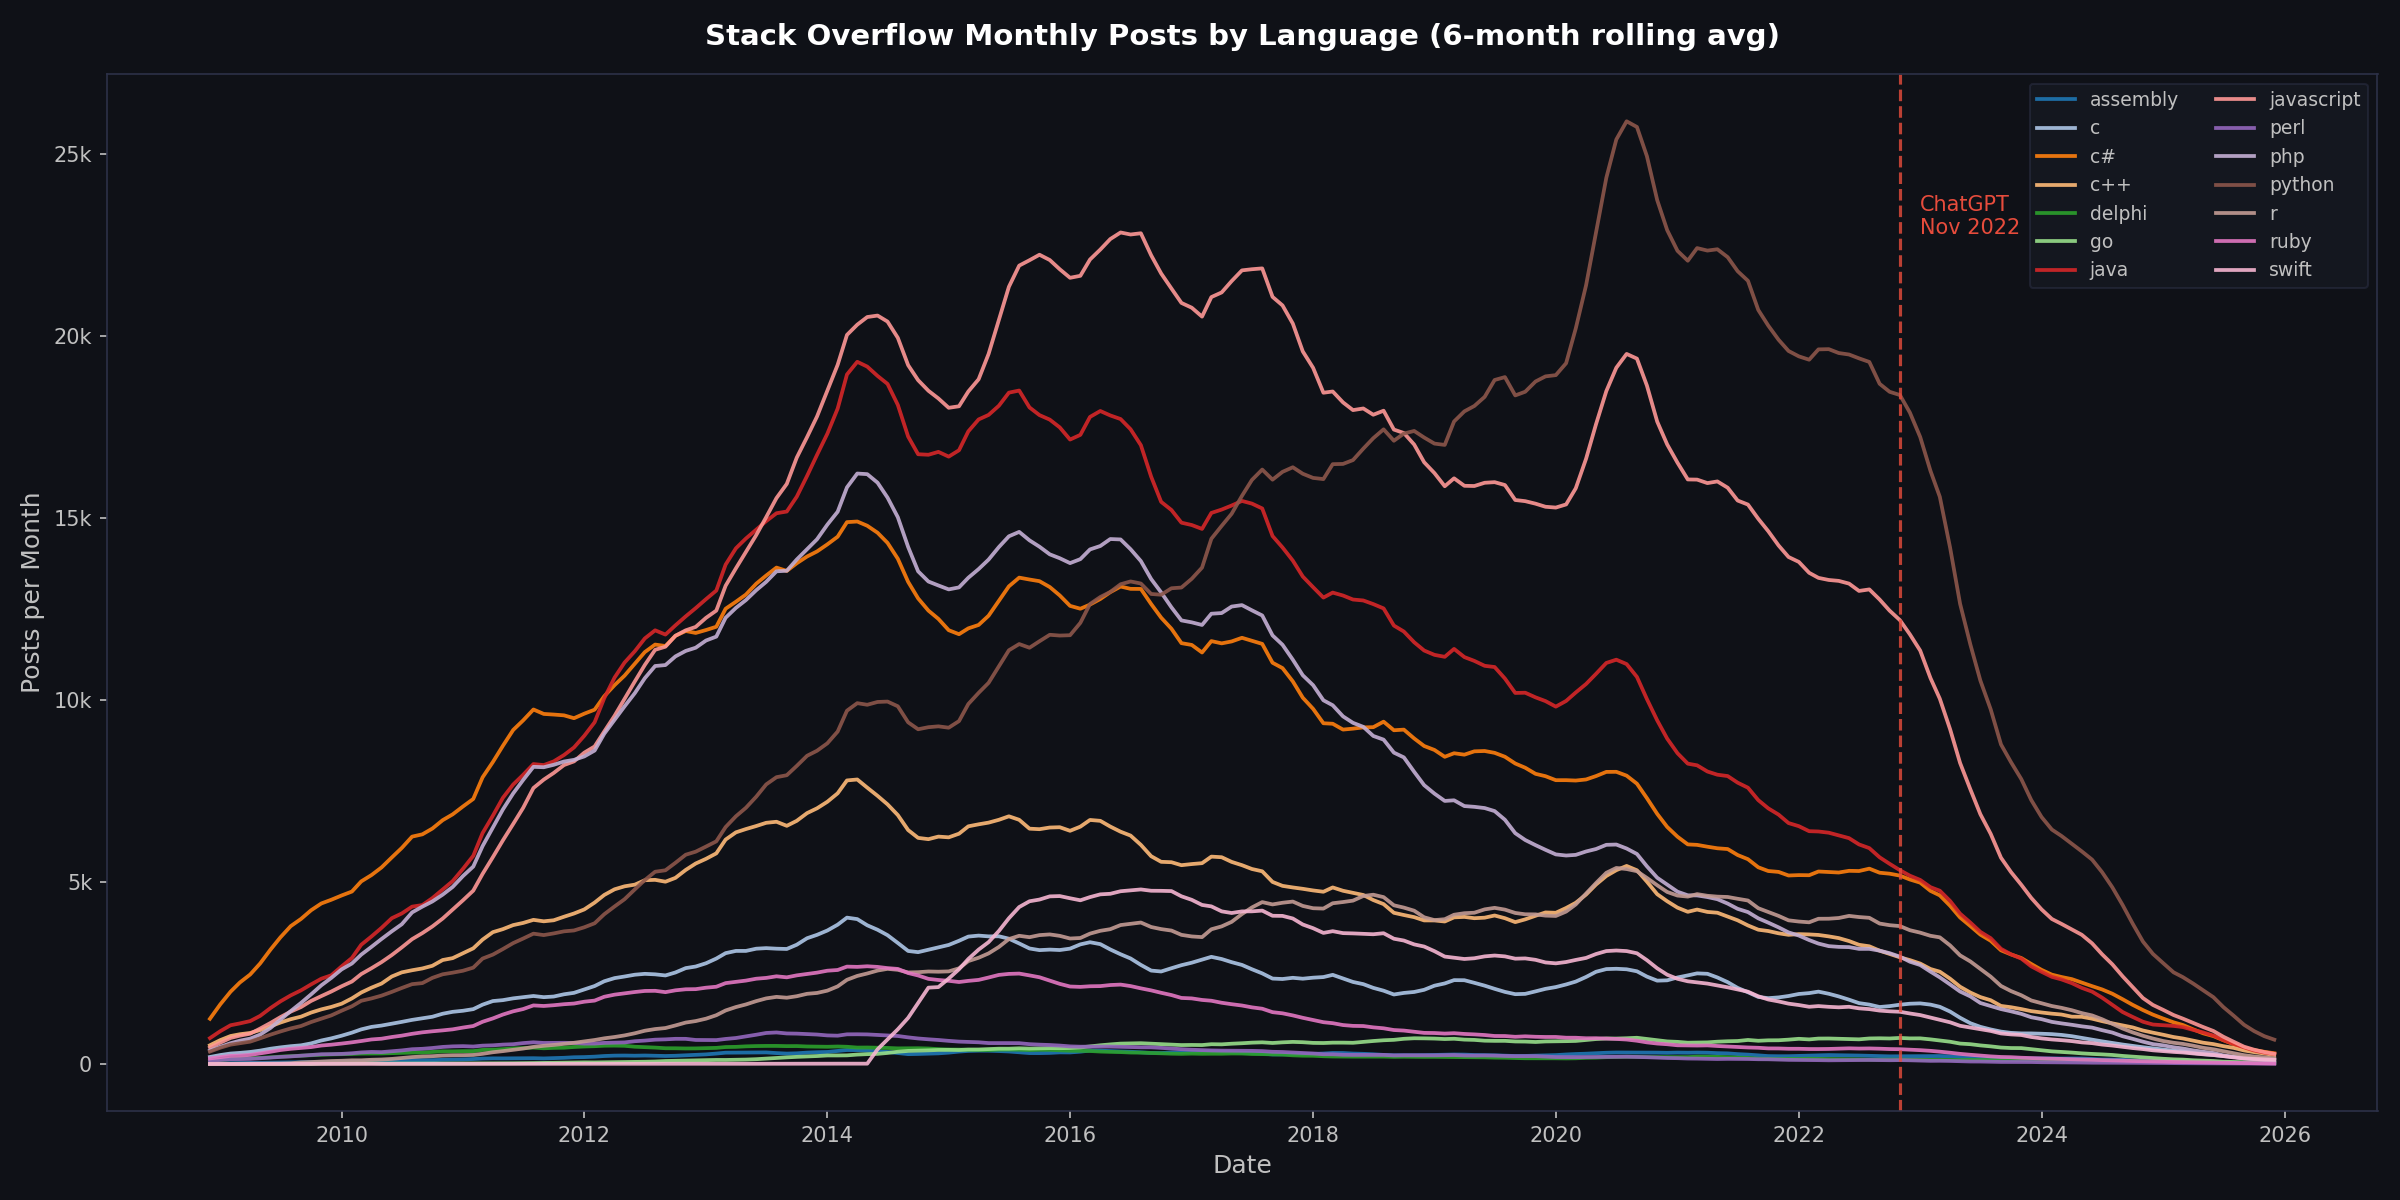
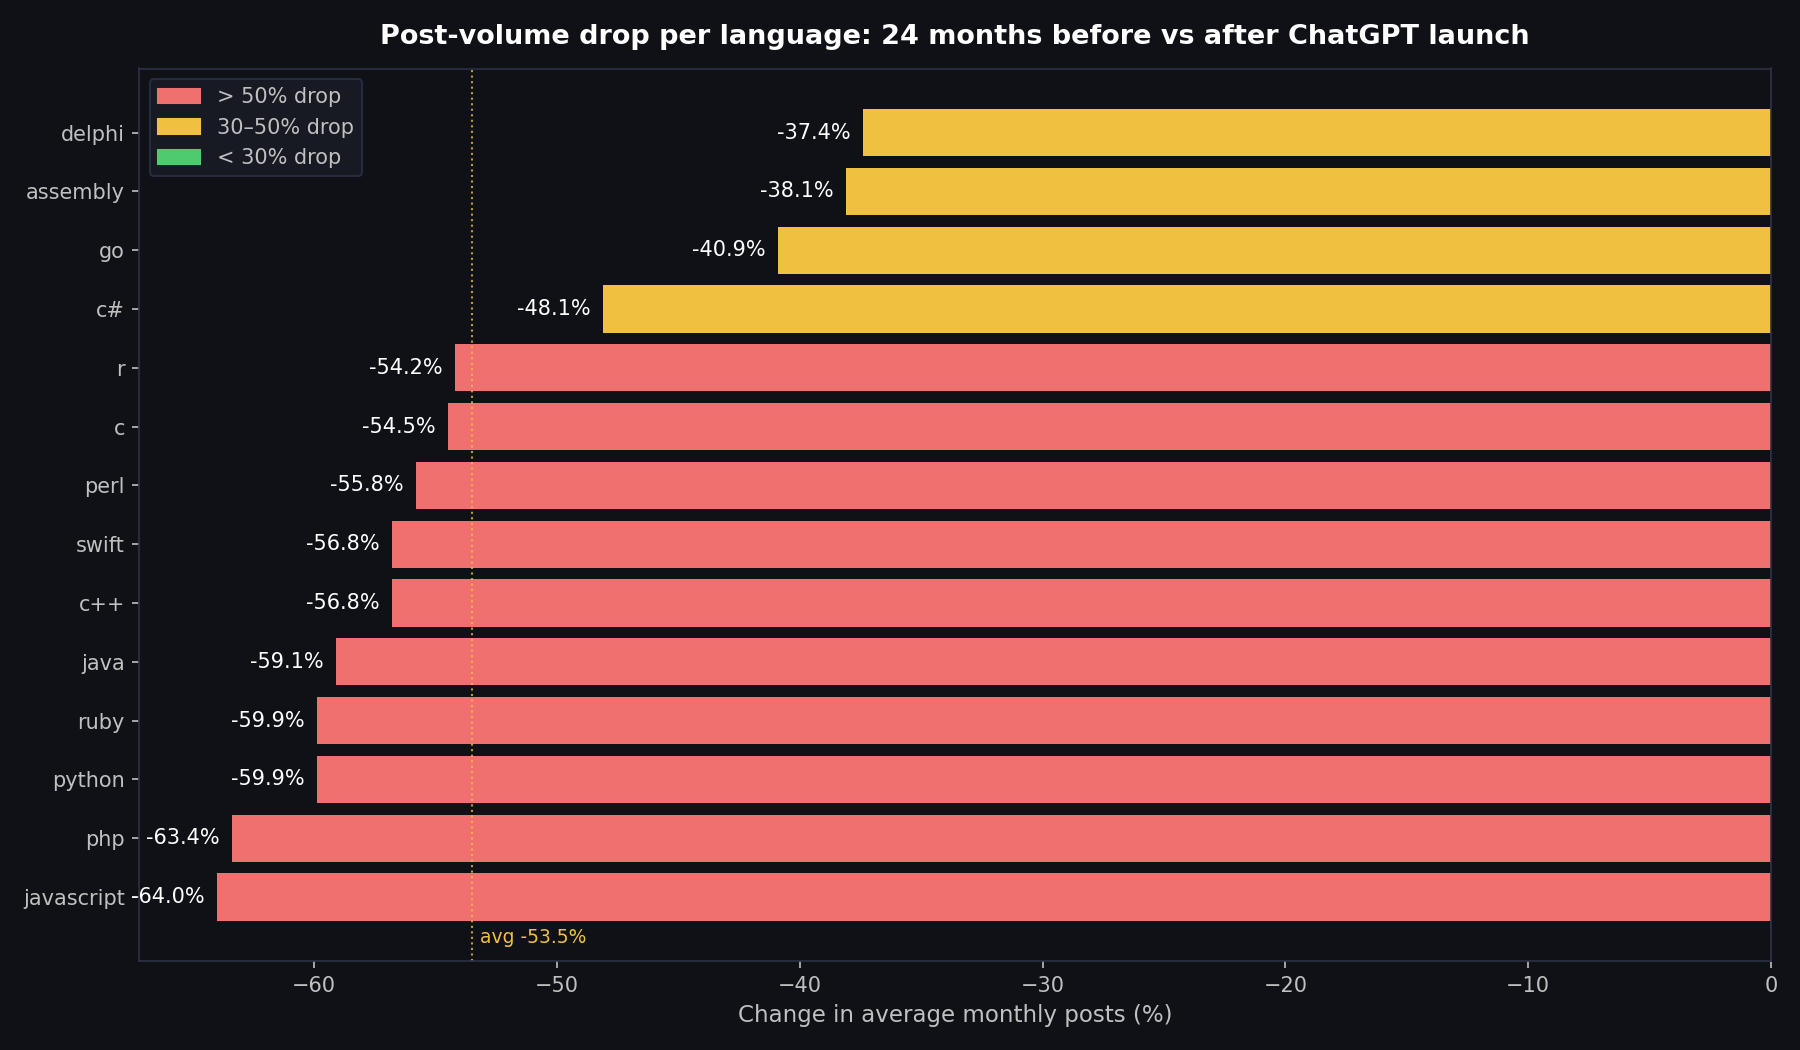
The first notebook establishes this forensically. Seven analytical lenses — platform velocity, pre/post ChatGPT window comparisons, language share, momentum scoring, lifecycle classification, and OLS regression against job data — converge on the same conclusion: ChatGPT didn't break Stack Overflow, it accelerated a structural decline already underway since 2017, and it did so hardest in the ecosystems where AI tooling is strongest. Python's SO count fell 59.9% precisely because Python developers were the earliest adopters of AI-assisted coding.
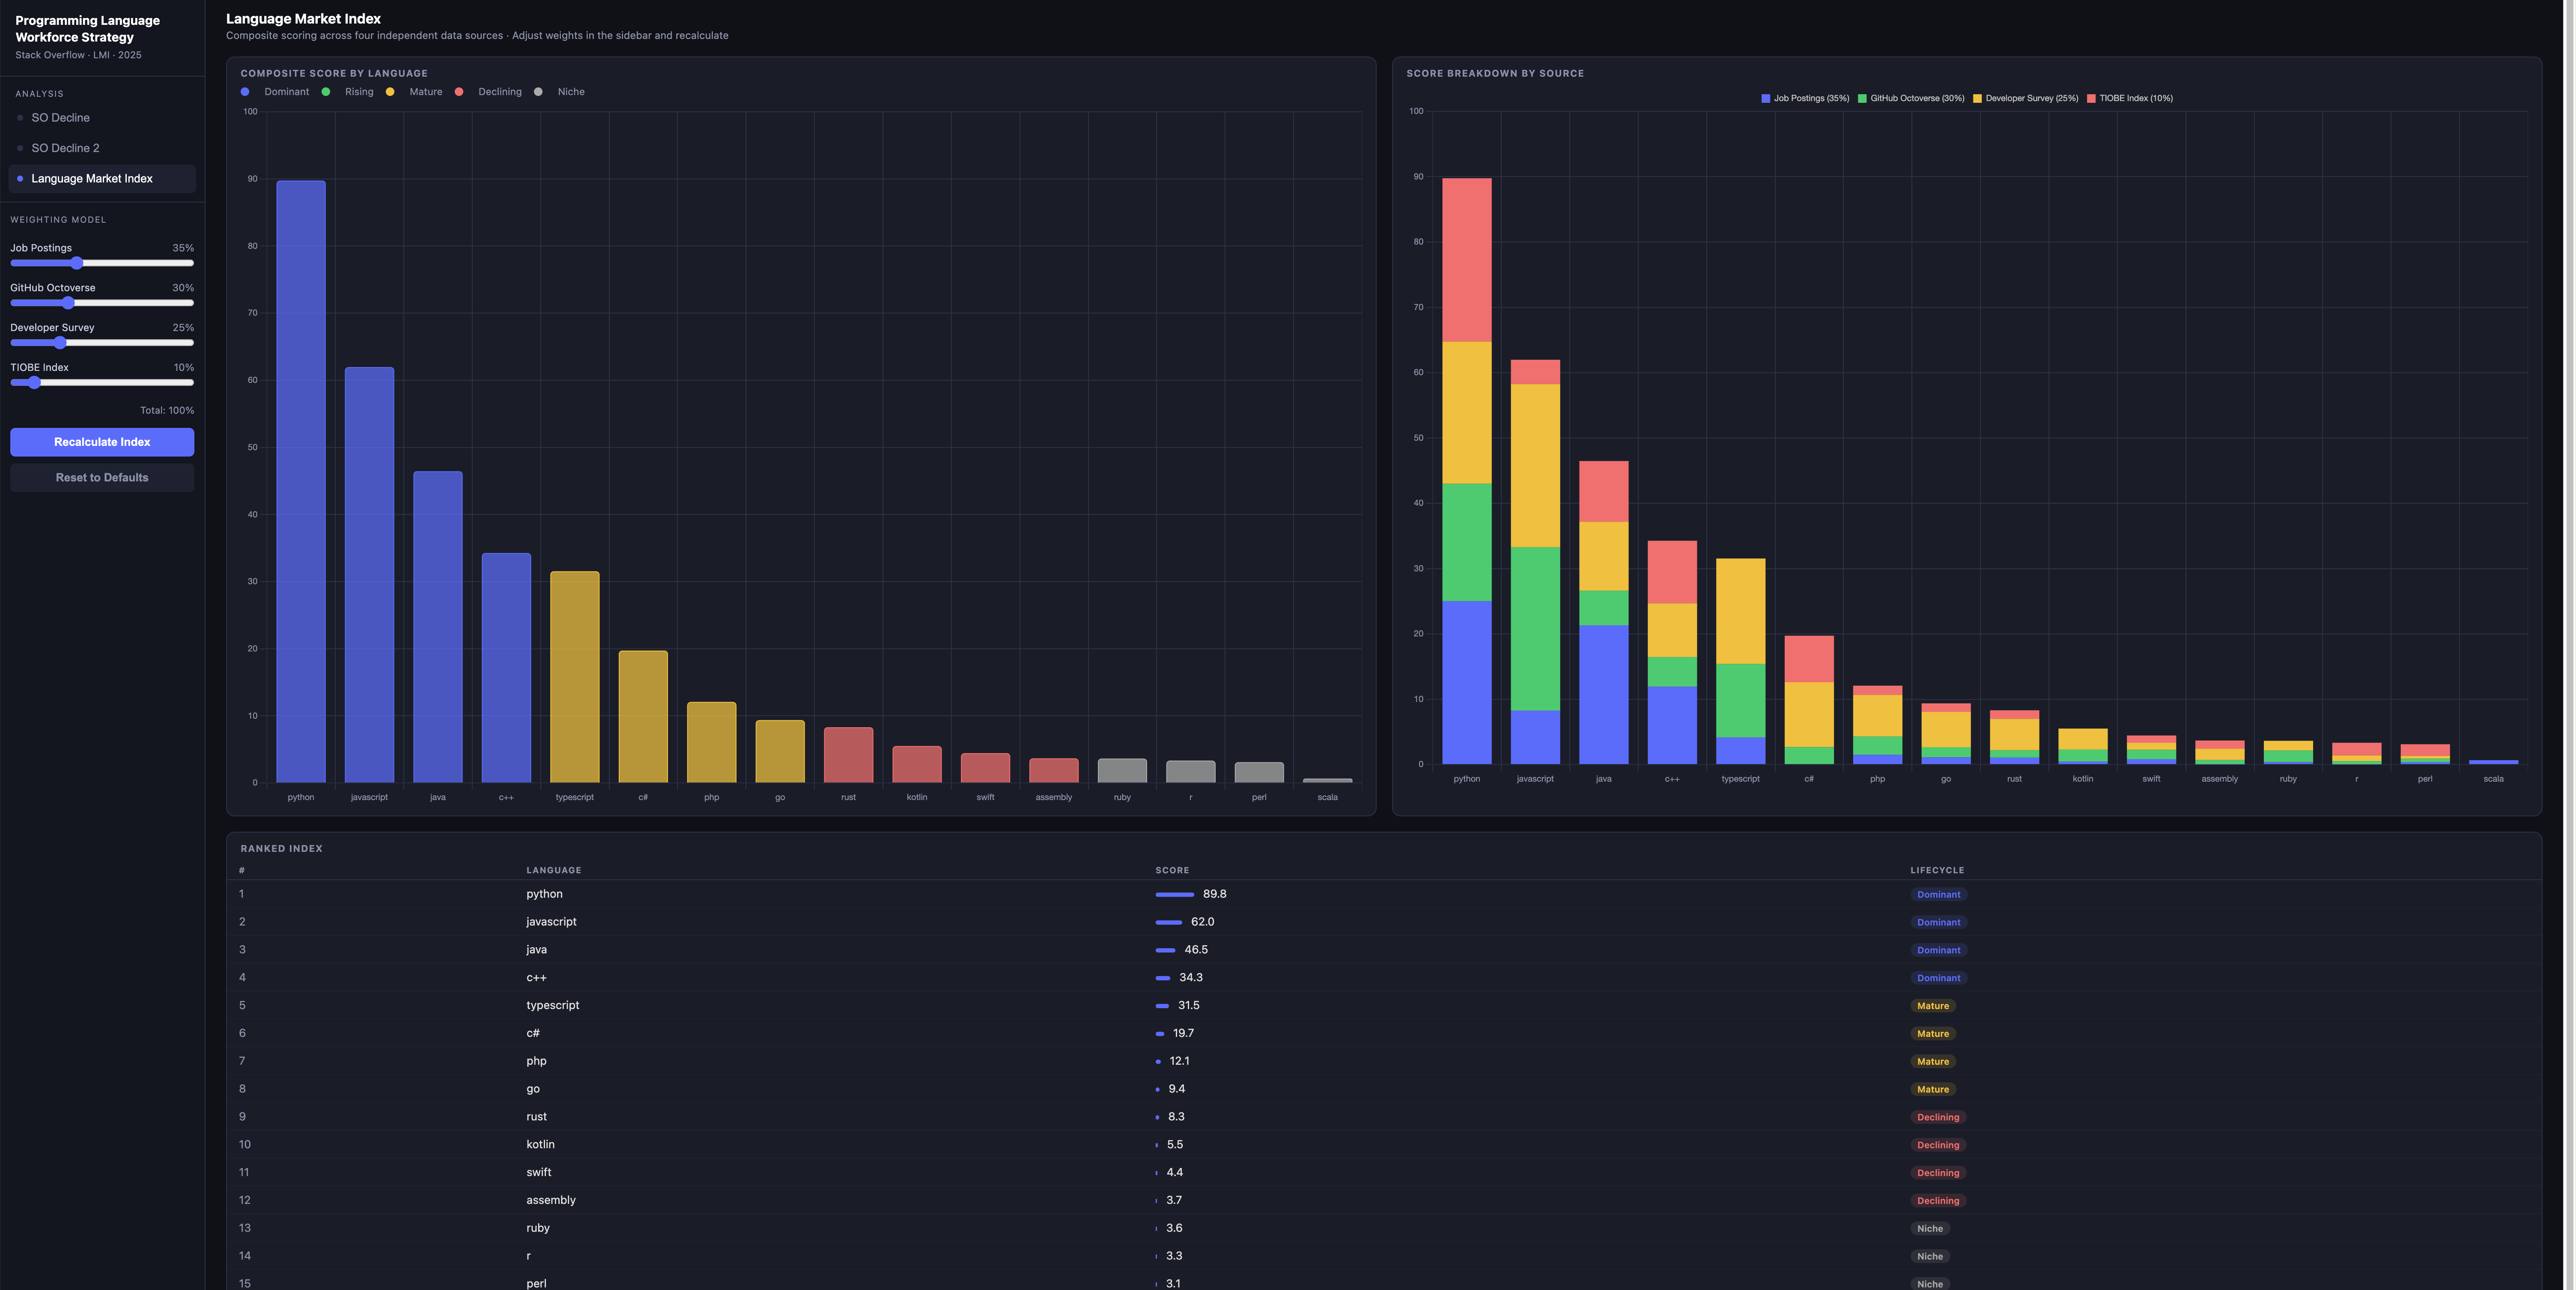
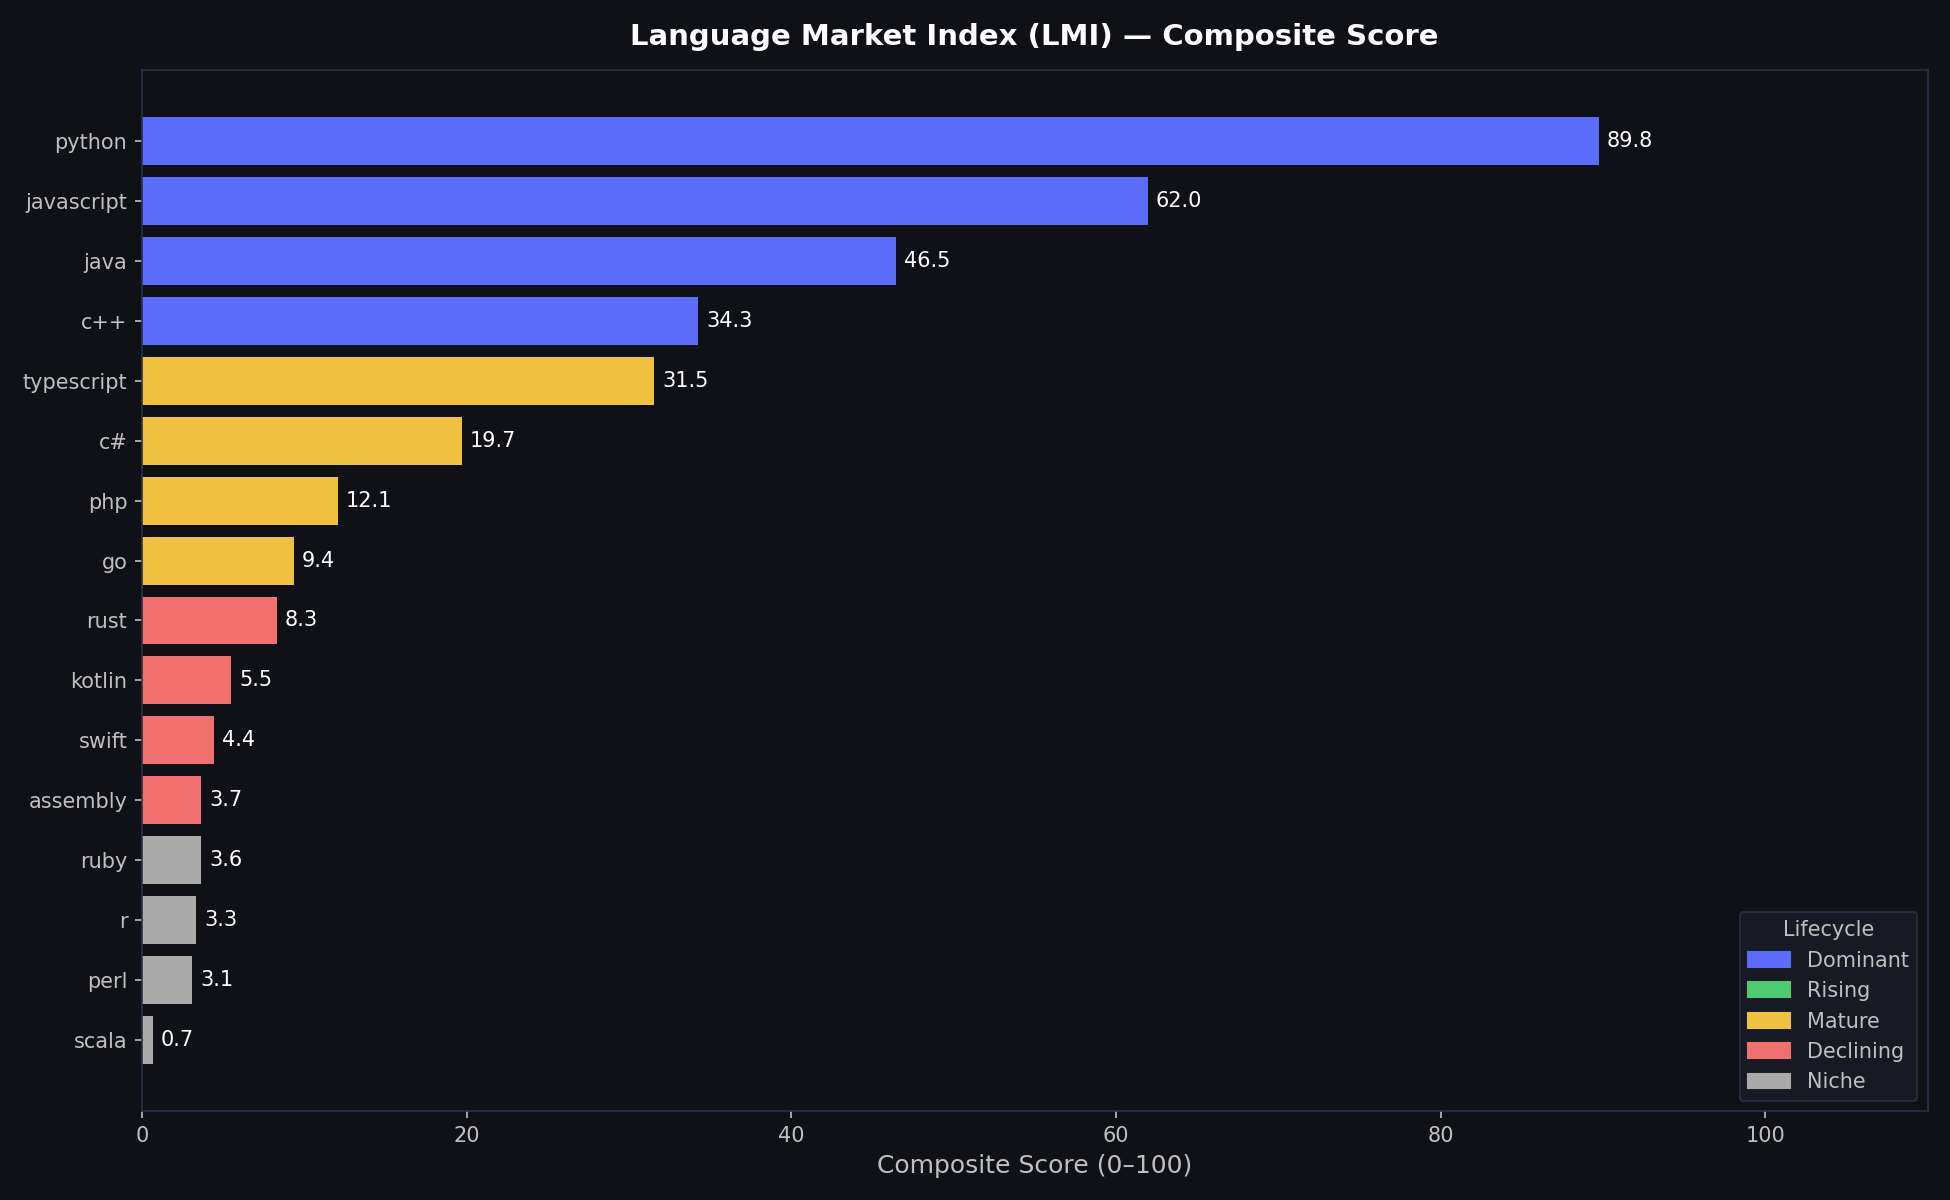
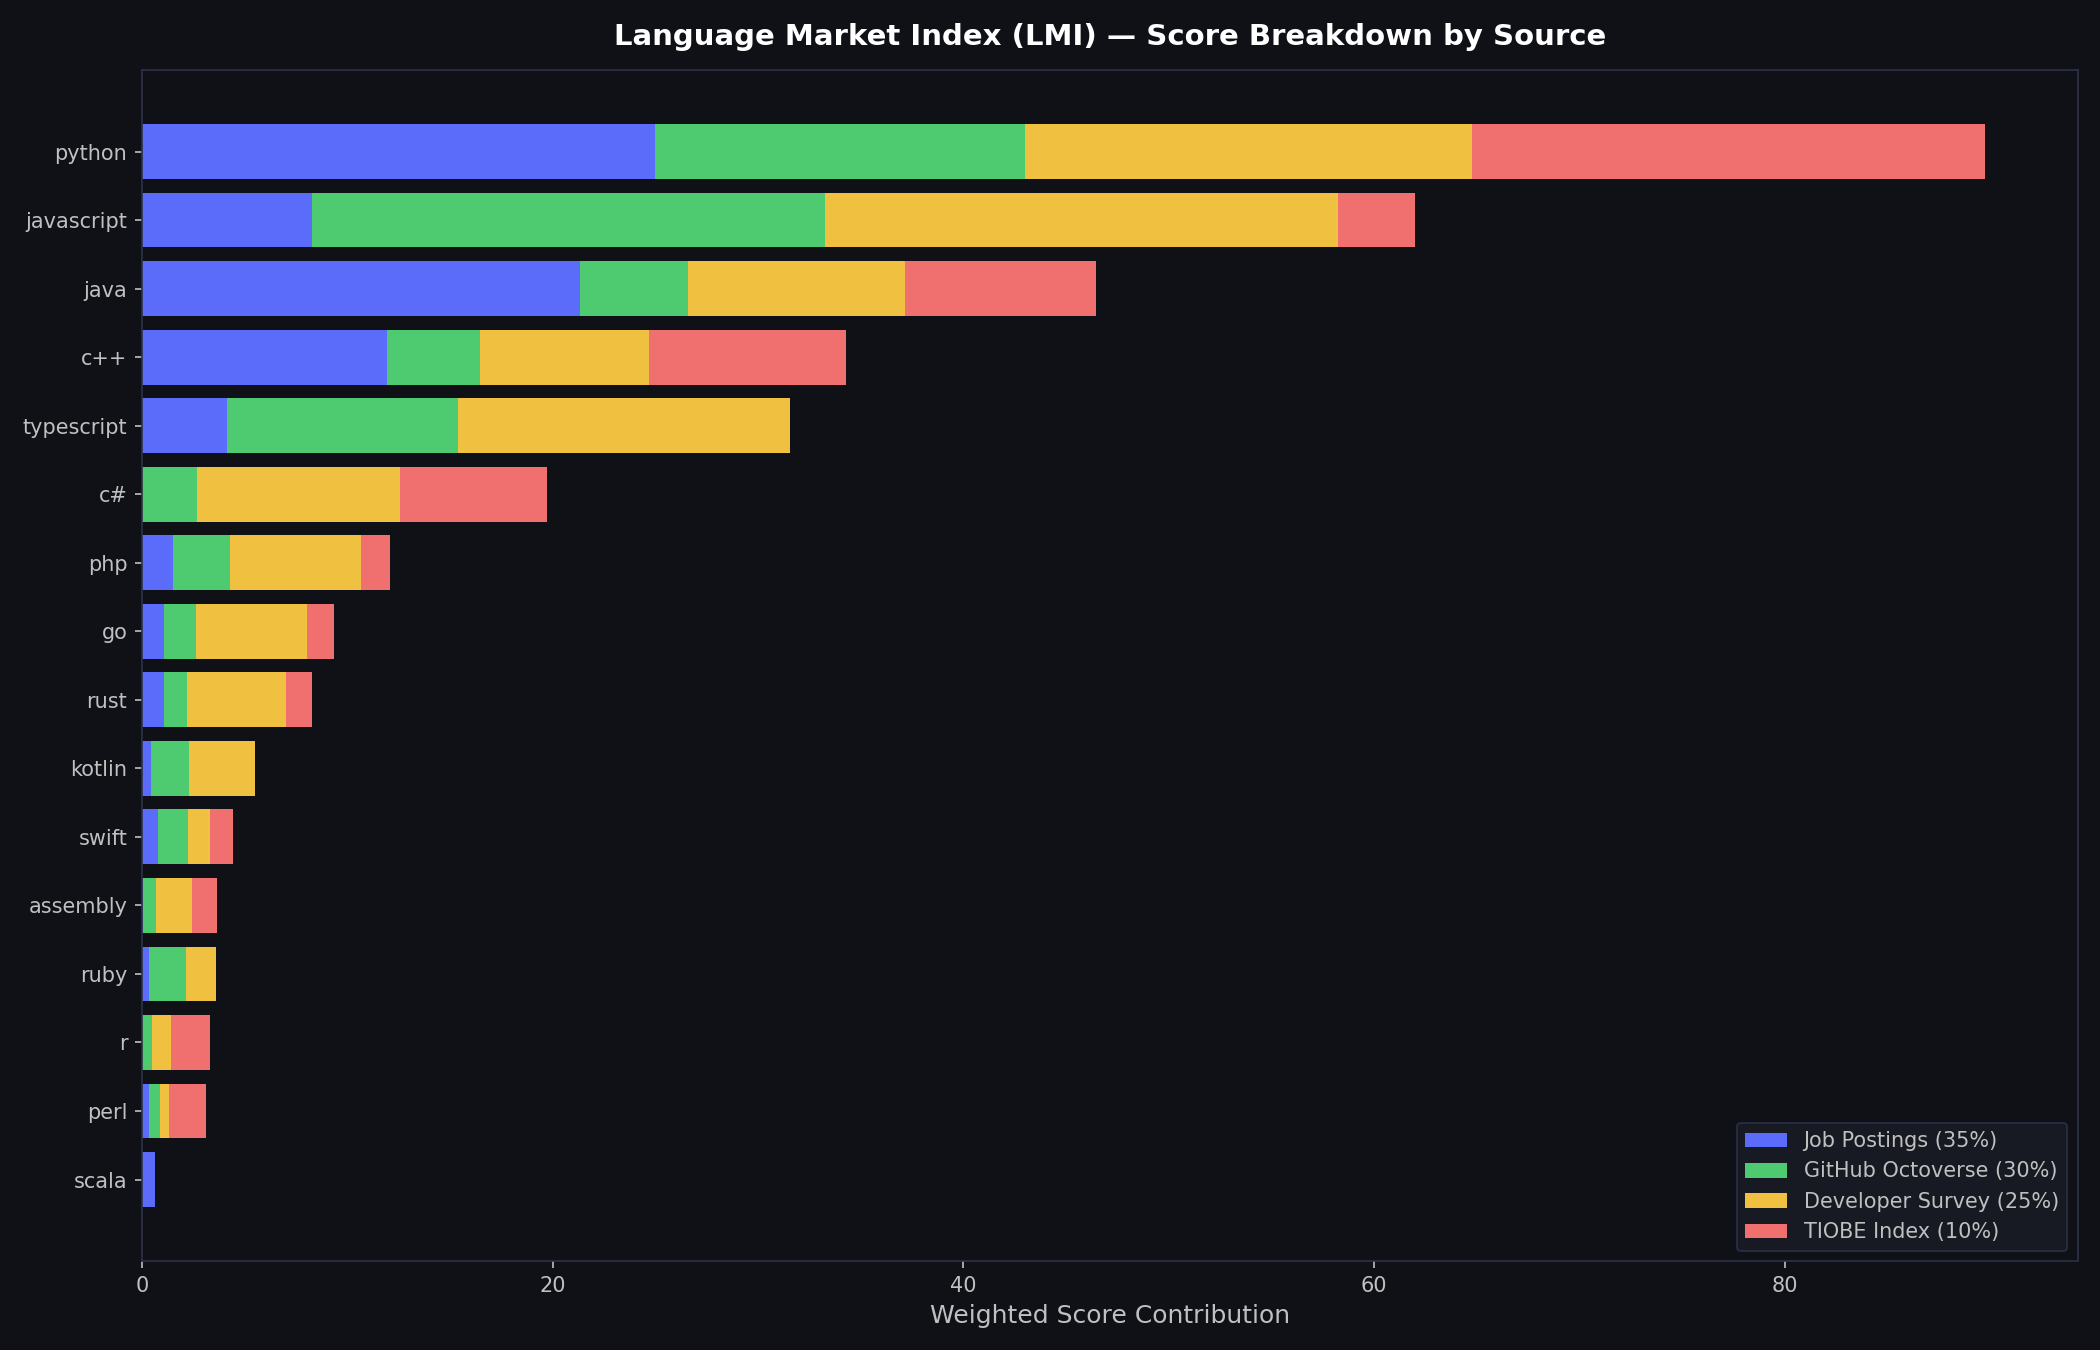
The second notebook builds the replacement. The Language Market Index (LMI) aggregates four independent signals — Adzuna job postings (35%), GitHub Octoverse activity (30%), SO Developer Survey usage (25%), and TIOBE ratings (10%) — normalised to a common 0–100 scale before weighting. Python leads at 88.4/100 across every weighting scenario tested. The index and its methodology are exposed through an interactive Flask dashboard where stakeholders can adjust weights in real time and watch the rankings respond.
Quick Facts
Overview
Problem
Technology consultancies routinely use Stack Overflow post volume as a proxy for language relevance and developer demand. The question this project set out to answer was whether that signal was still trustworthy after the widespread adoption of AI coding assistants — and if not, what should replace it.
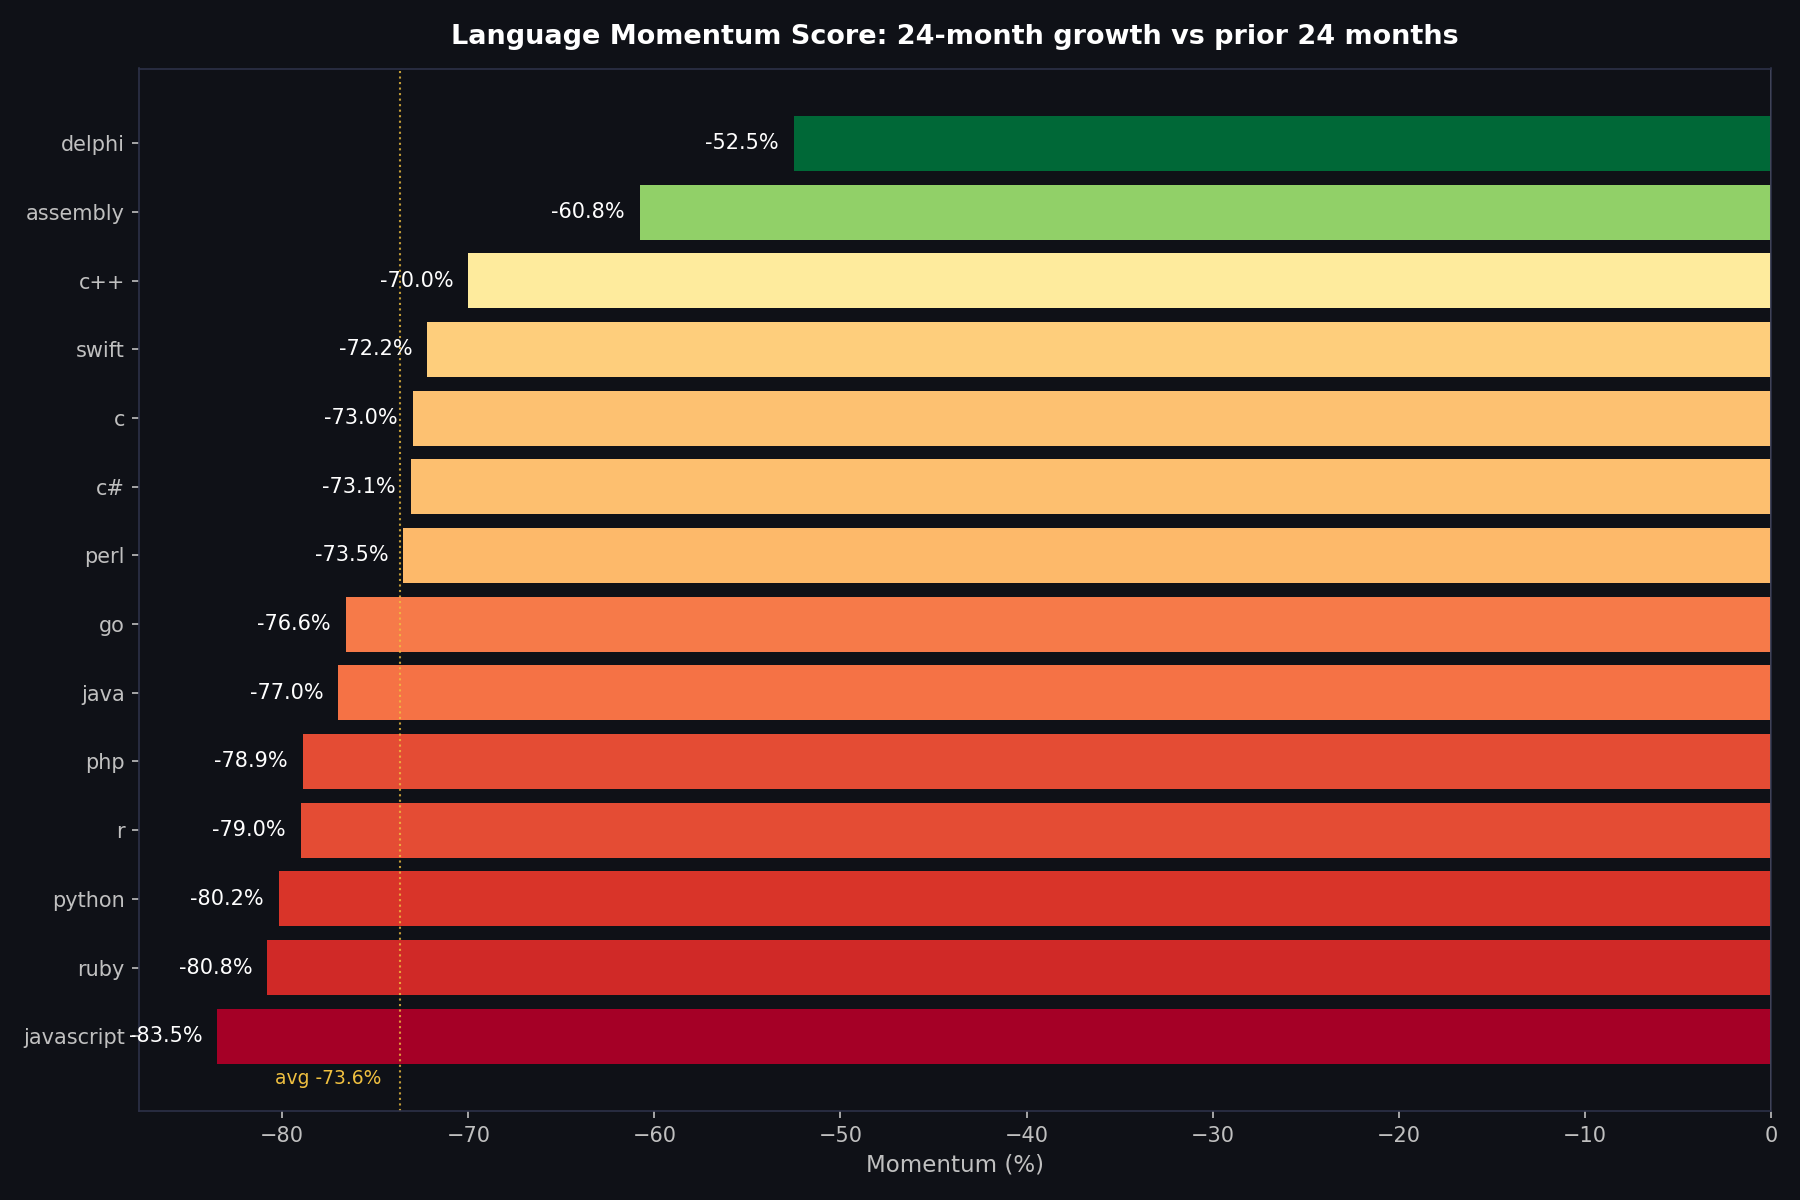
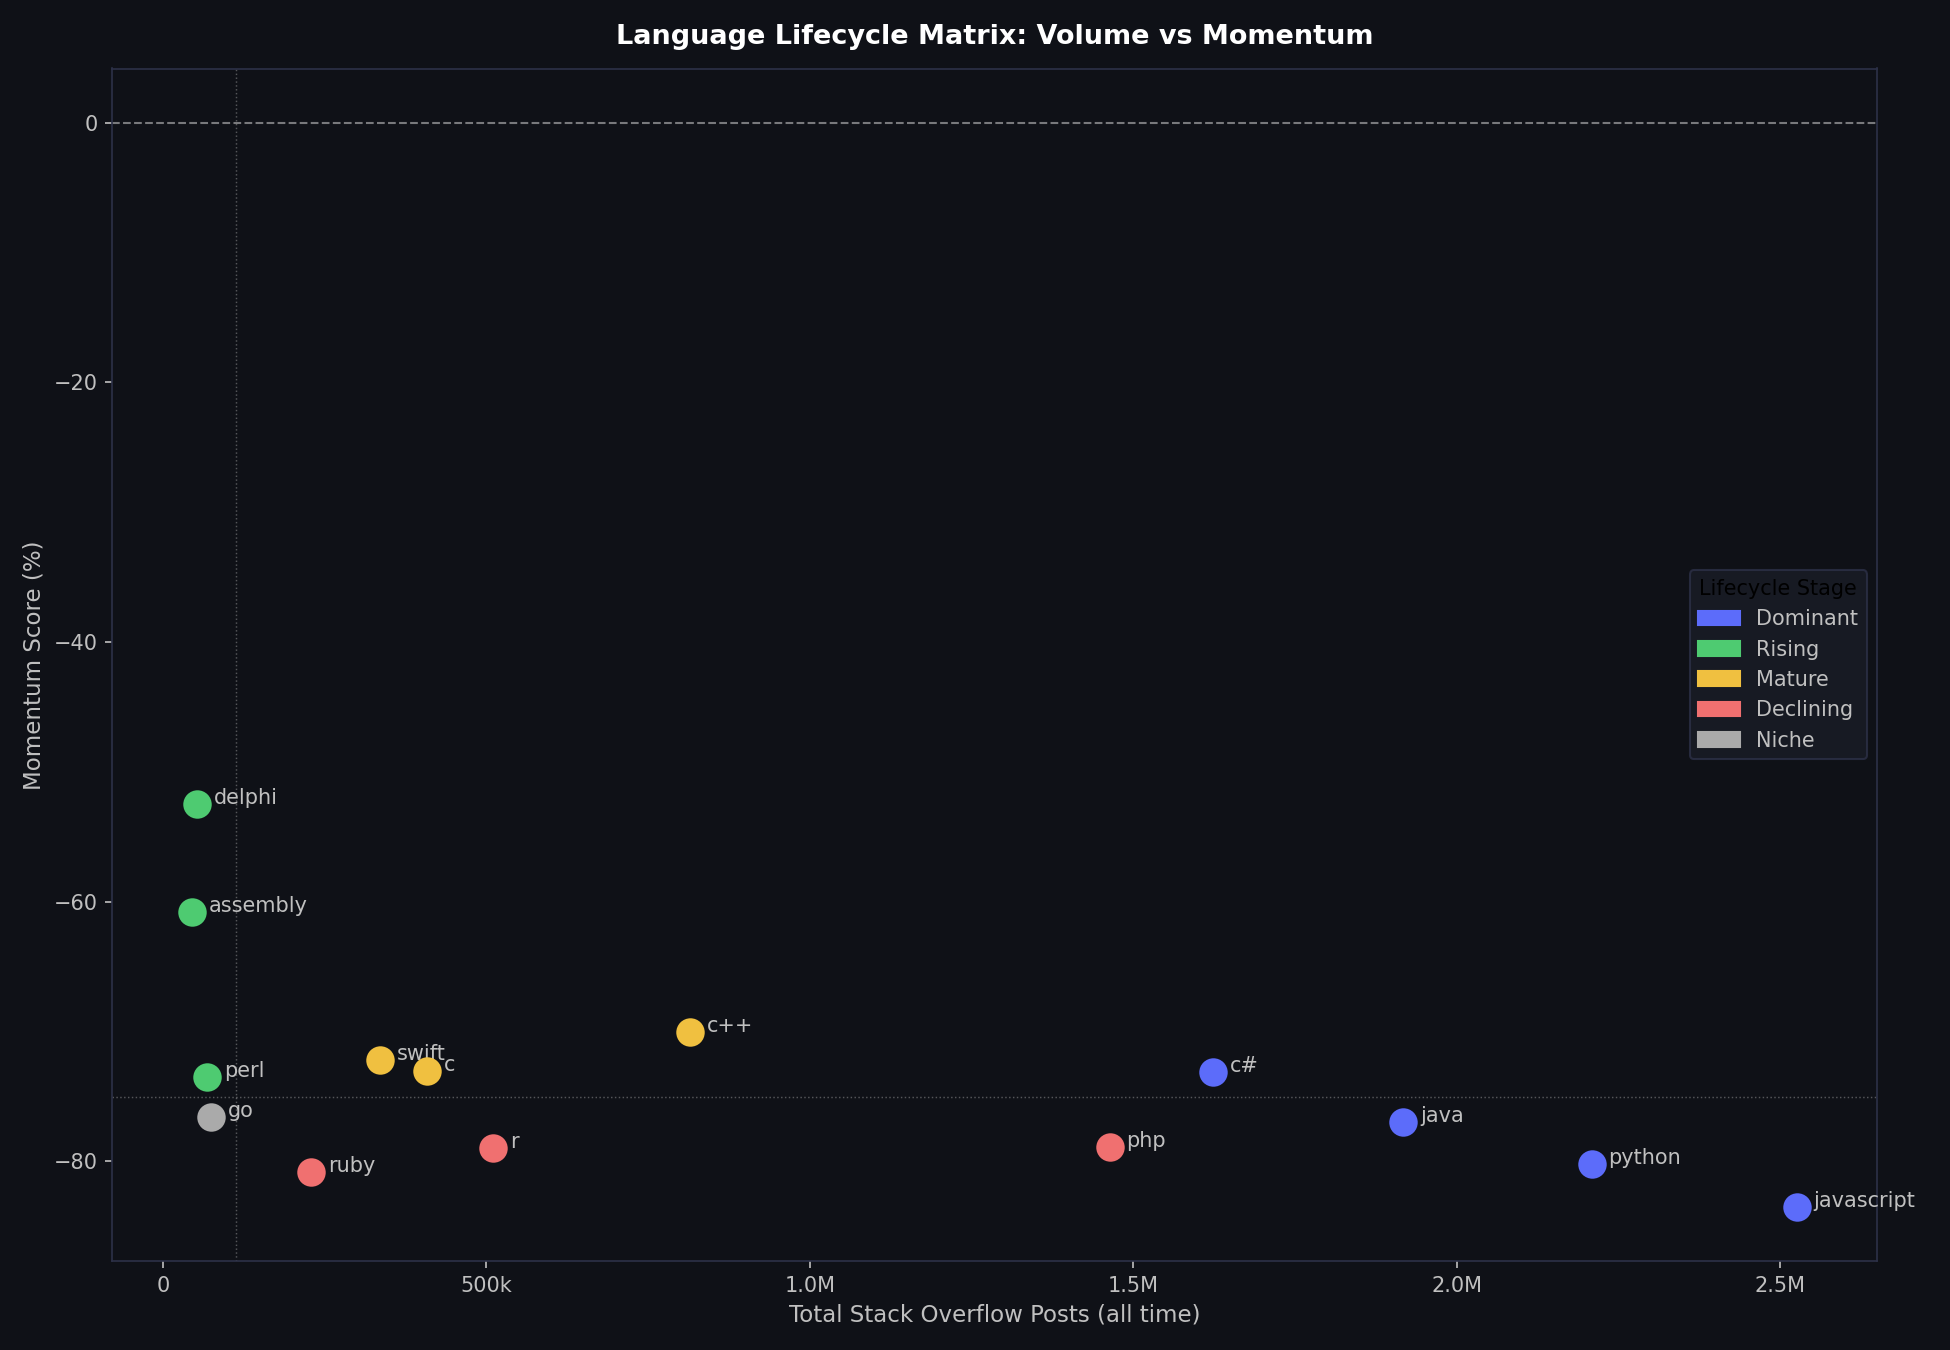
The business stakes are concrete: hiring and training investment decisions made on a flawed signal produce misallocated capability. If a consultancy ranks languages by SO momentum, it would currently prioritise Assembly and Delphi over Python and JavaScript — an inversion of actual market demand that would cost real money in the wrong hires.
Solution
Project 1 treats SO data as a forensic investigation rather than a dashboard. Monthly post counts for 14 languages from 2008 to 2025 are analysed through rolling averages, window comparisons, share normalisation, momentum scoring, and percentile-based lifecycle classification. The anti-correlation with Adzuna job data is tested via scipy's linregress and Pearson r — confirming the signal isn't just noisy but directionally wrong.
Project 2 replaces it. A four-source ingestion pipeline fetches and caches job postings (Adzuna REST API), developer activity (GitHub Octoverse public dataset), self-reported usage (SO Developer Survey CSVs), and industry ratings (TIOBE scraper with hardcoded fallback). Each source is min-max normalised independently before weighting — removing scale differences between a job count of 50,000 and a GitHub pusher count of 2 million. The composite index is stress-tested across four weighting scenarios including extremes (60% single-source) to verify the top-tier ranking is robust to methodology disagreements.
All chart data is computed server-side at page load and injected into the Flask template as a single JSON object, eliminating page-load fetch calls. Two endpoints remain live: one for real-time weight recalculation, one for per-language detail on click.
Challenges
The hardest methodological problem was distinguishing between "SO is declining" and "SO is declining as a signal." A platform losing traffic could still produce a reliable relative ranking. The anti-correlation finding (r = −0.26) required careful construction: comparing SO momentum to Adzuna job counts directly is confounded by language popularity, so the momentum metric was built as a self-referential measure (recent 24 months vs prior 24 months) to control for absolute scale before running the regression.
The TIOBE scraper was a persistent practical problem. tiobe.com blocks automated requests at the WAF level, returning valid HTTP responses but with no data. The solution was a two-stage approach: attempt the live scrape, validate against a set of key languages that must be present, and fall back to a manually sourced dataset when the check fails. This is fragile by design — the fallback will go stale — but it surfaces the fragility explicitly rather than silently returning zeros.
Normalising four sources with fundamentally different units and distributions into a single comparable scale meant that the choice of normalisation method had real consequences. Min-max scaling was chosen over z-score because it preserves the 0–100 interpretability that makes the index legible to non-technical stakeholders, but it means a new language entering the tracked set can shift every other language's score — a limitation documented in the sensitivity analysis.
Results / Metrics
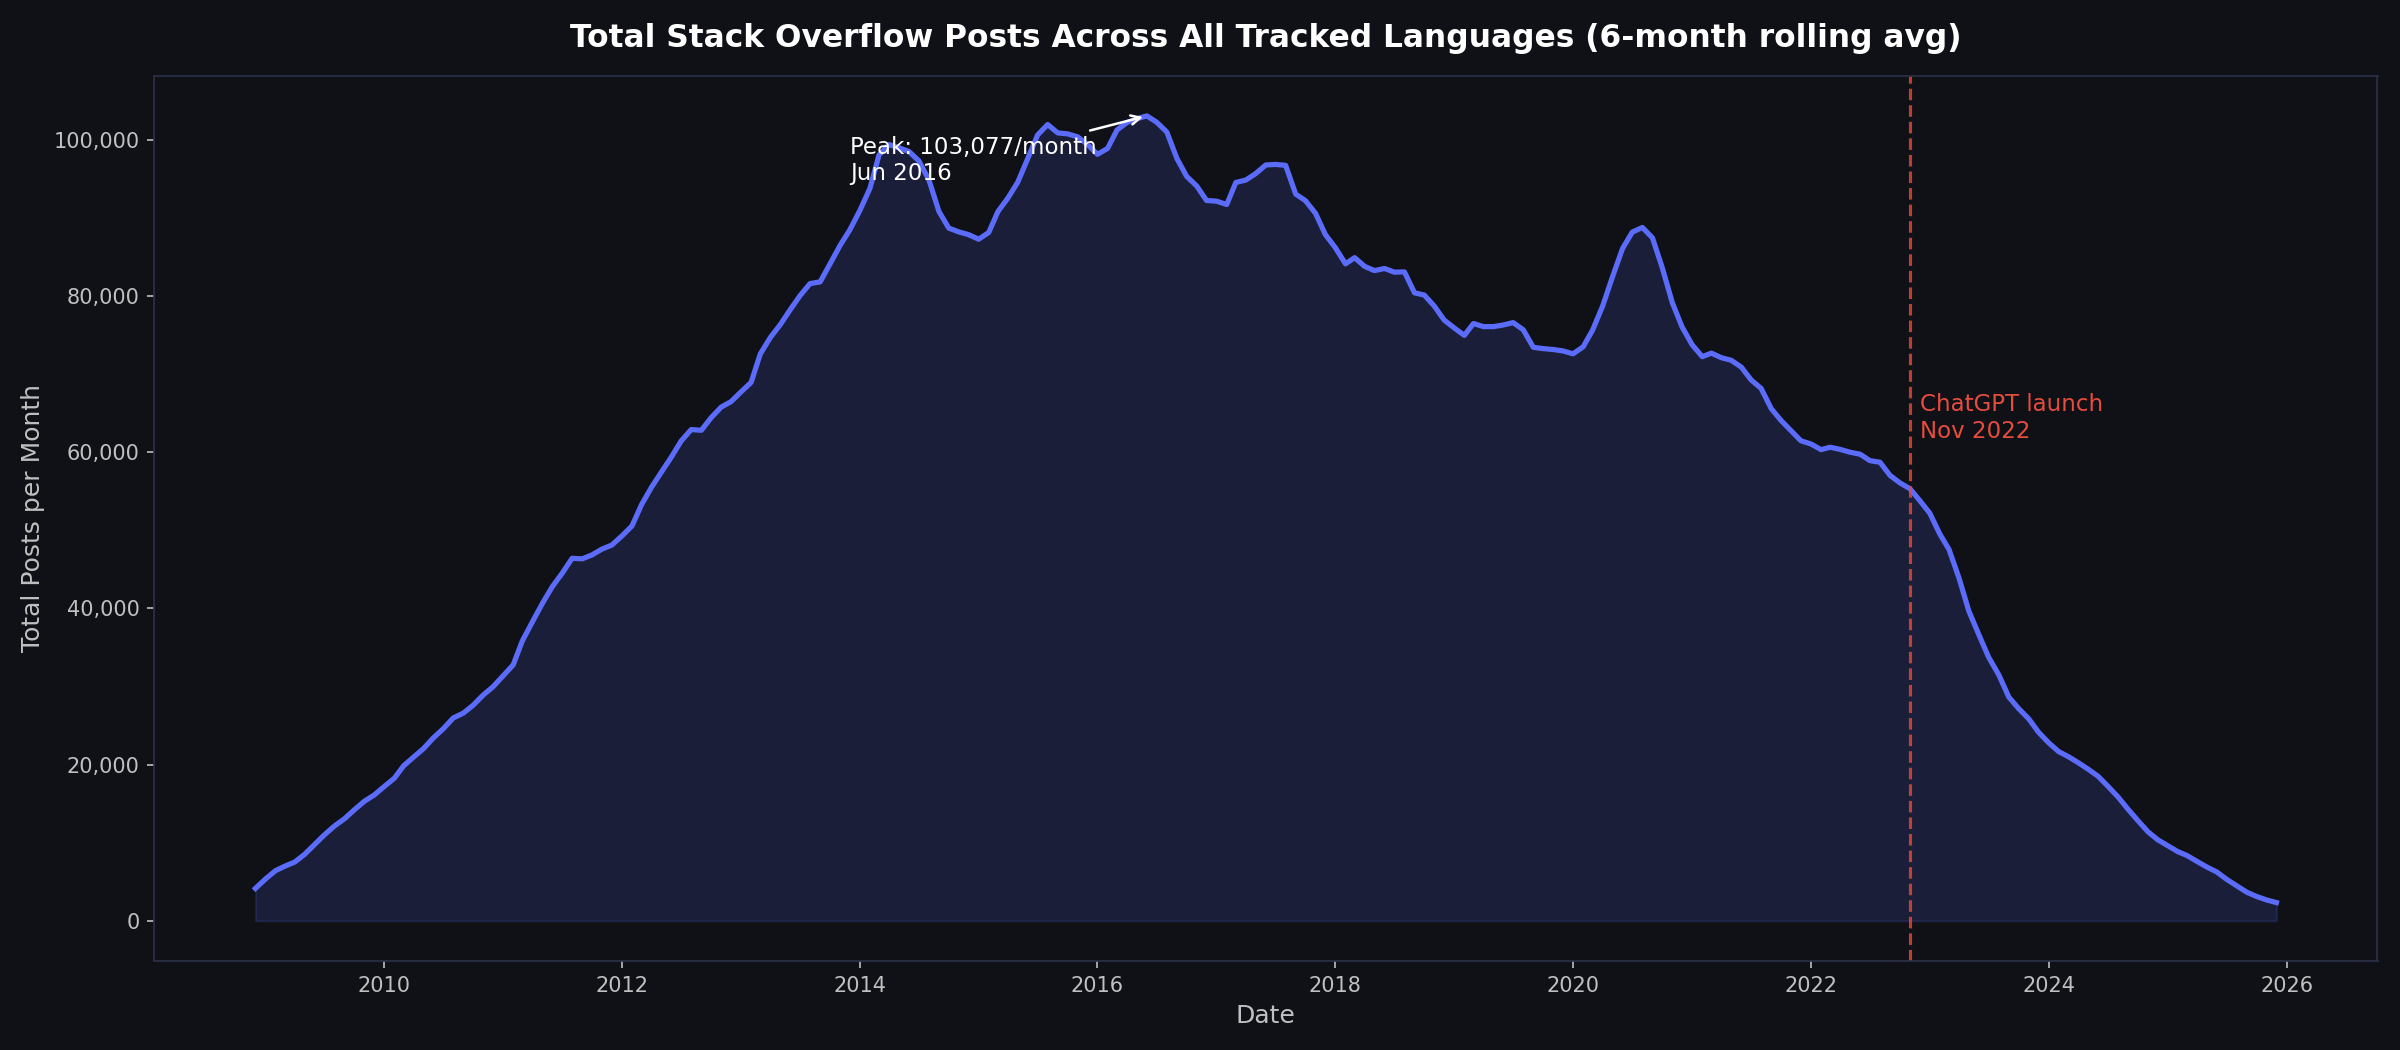
Stack Overflow post volume peaked at 103,077 posts/month in June 2016 and reached 2,338/month by December 2025 — a 97.7% collapse. The post-ChatGPT acceleration is 15× the pre-ChatGPT decline rate (−7.6%/month vs −0.5%/month). SO momentum anti-correlates with Adzuna job demand at r = −0.26: the five languages with the worst SO momentum scores are the five most-hired languages in the job market.
The Language Market Index ranks Python first (88.4/100) across every weighting scenario tested. JavaScript (68.0), TypeScript (42.5), and Java (24.9) form the stable Dominant tier — the only four languages where all four independent signals simultaneously agree. The top-5 composition is unchanged whether job postings carry 35% or 60% of the weight. Rust and Kotlin are identified as leading-indicator languages: strong developer survey scores with weak current job counts, signalling early-adoption curves that the index will capture as they mature.
Screenshots
Click to enlarge.
Click to enlarge.