LEGO Dataset Analysis
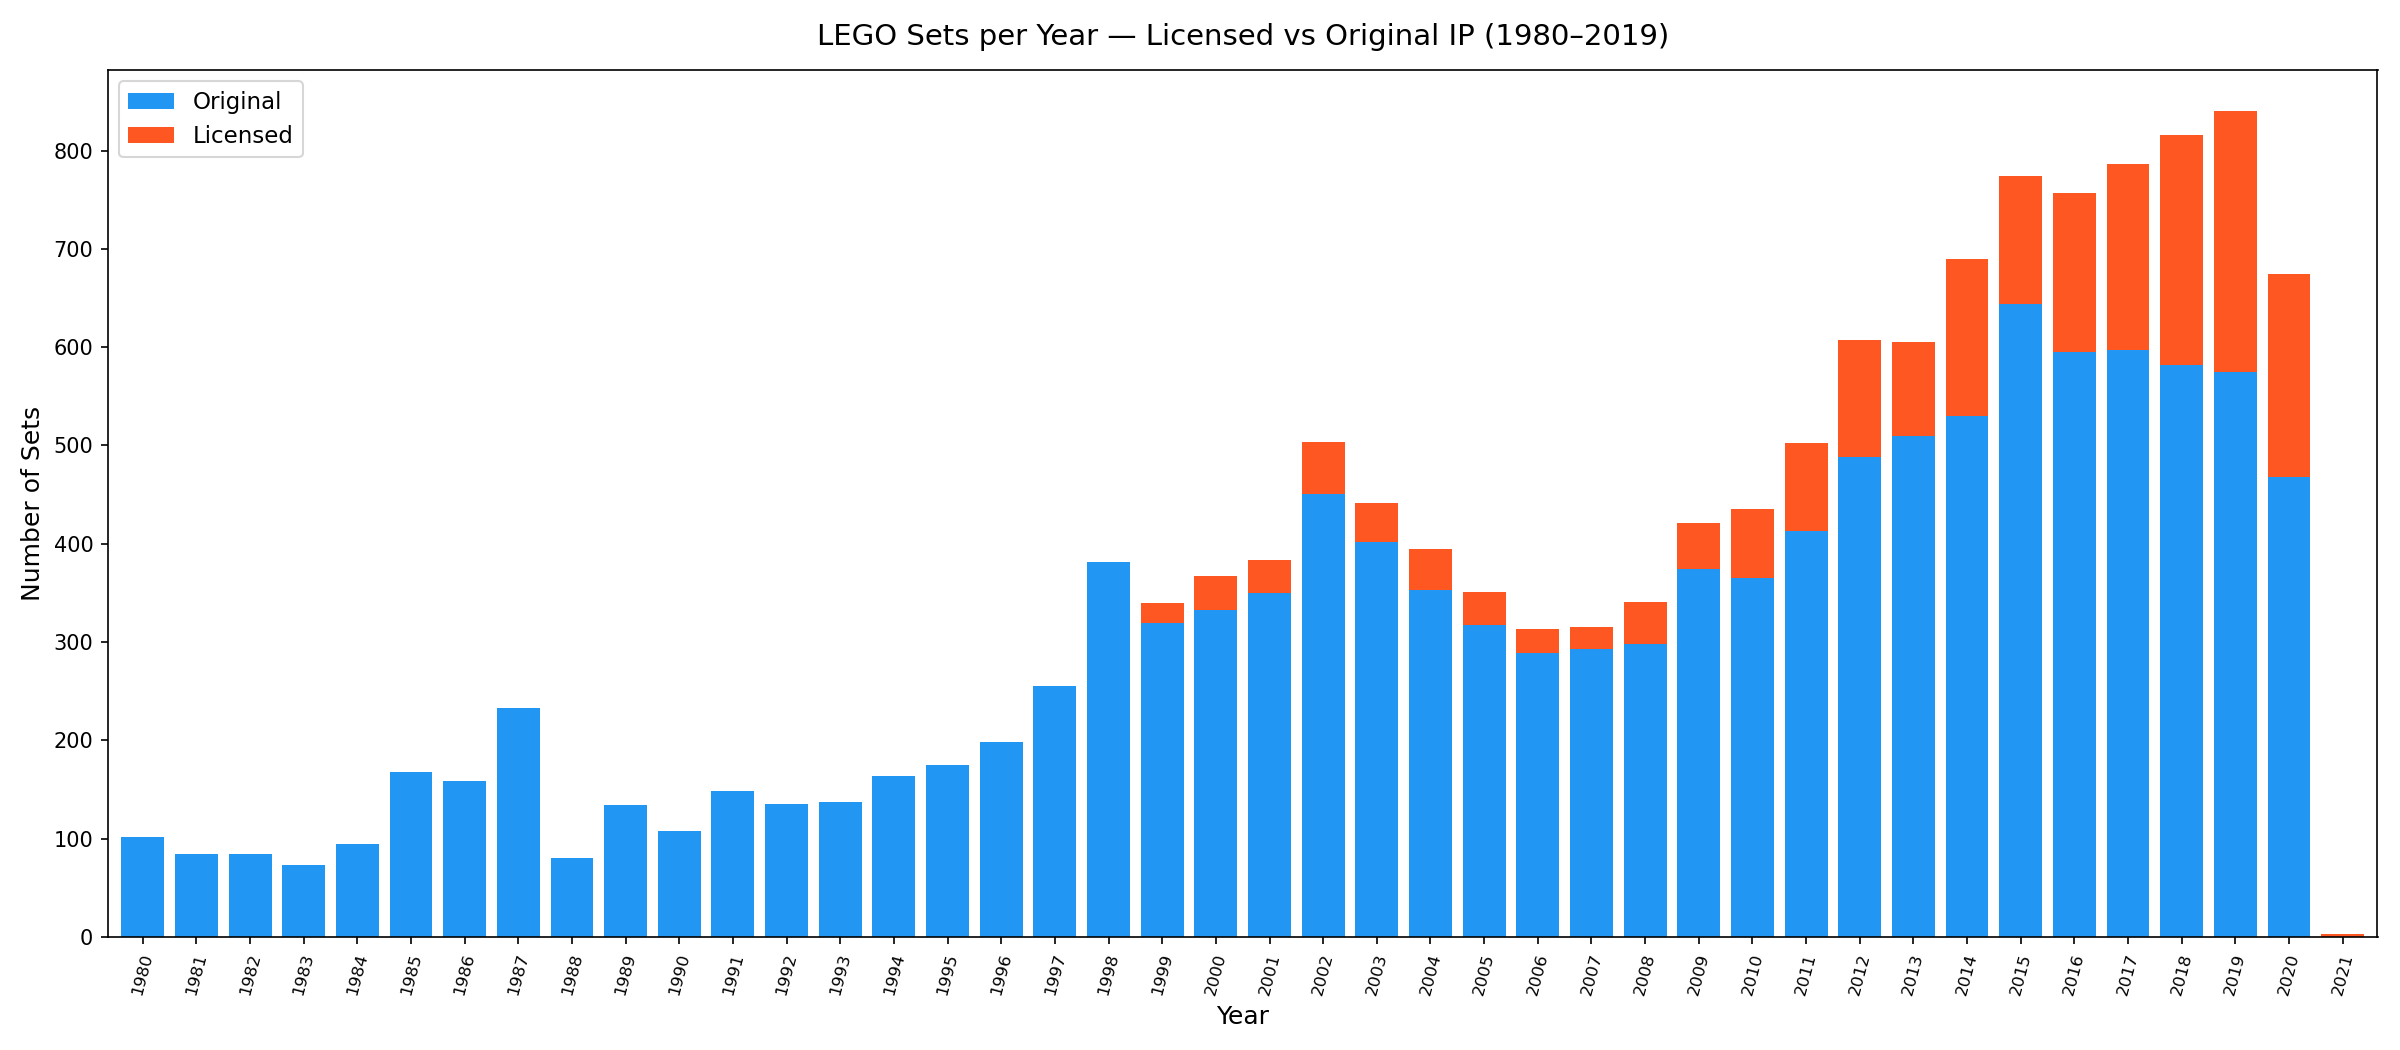
LEGO posted its first annual loss in 1998 and was reportedly days from being acquired by Mattel by 2003. The turnaround coincided almost exactly with the Star Wars deal in 1999 and Harry Potter in 2001. I wanted to go beyond the business school narrative and actually measure what changed at the product level — not just whether LEGO released more sets, but whether the nature of what they were building shifted.
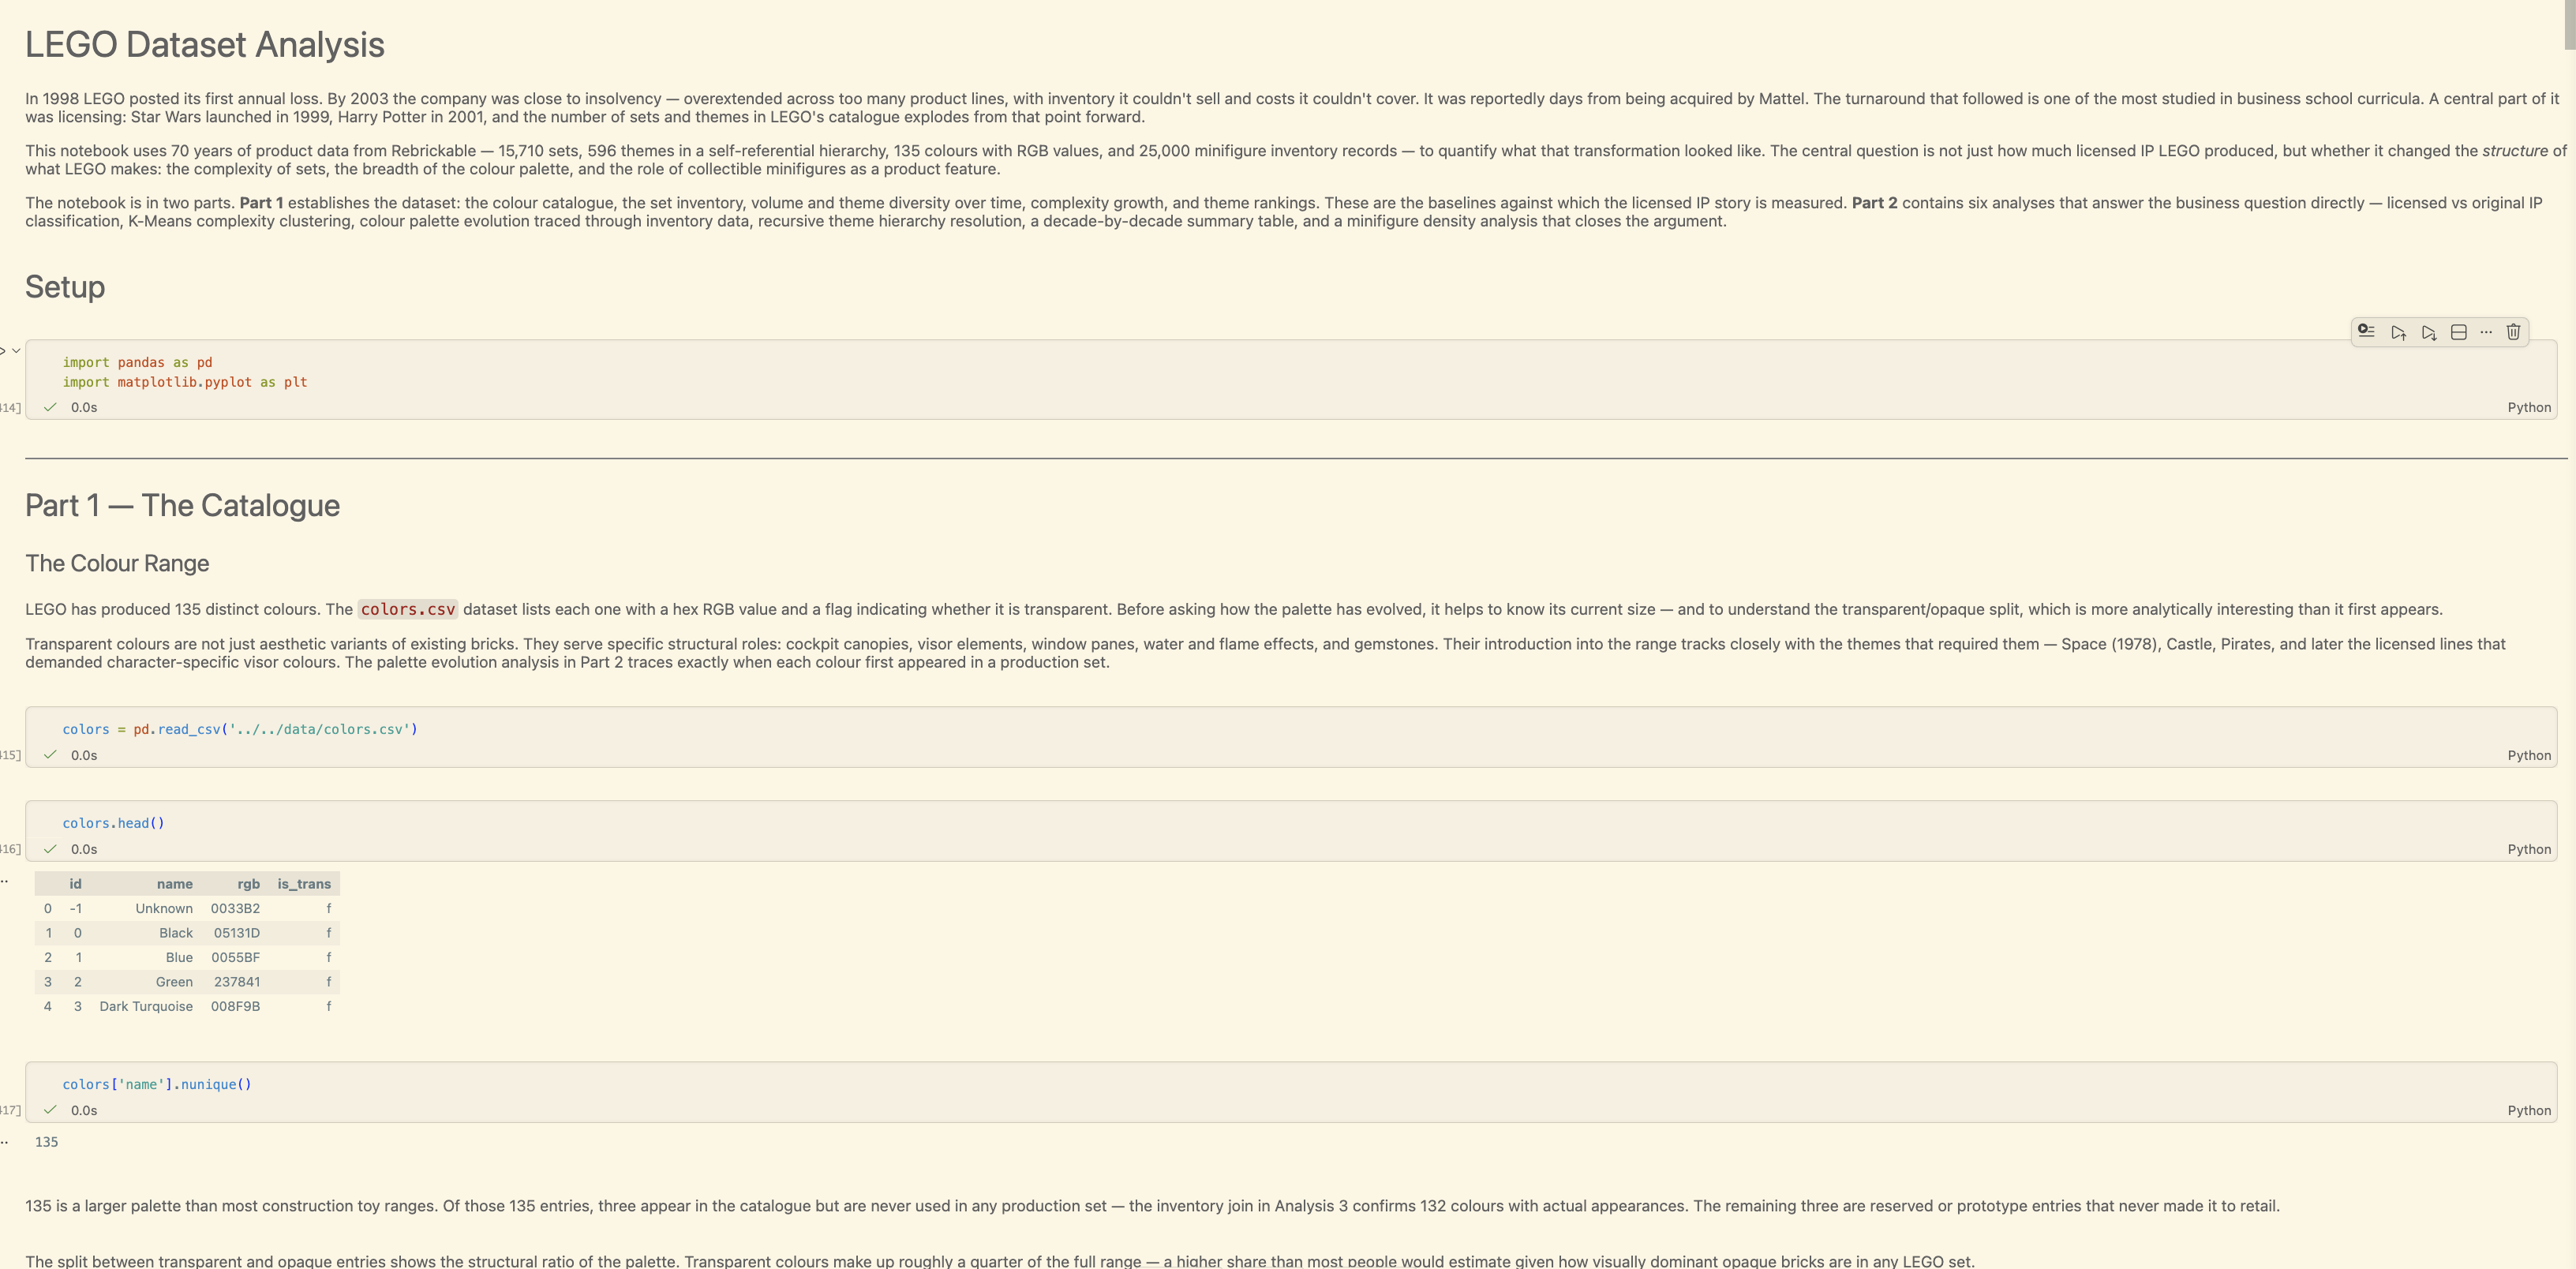
My intention with this project was to answer one question: did licensed IP transform what LEGO makes, or just how much of it? I joined six relational tables across Rebrickable's complete product history — 15,710 sets, 596 themes, 135 colours, and 25,000 minifigure inventory records — and ran six analyses to build the case.
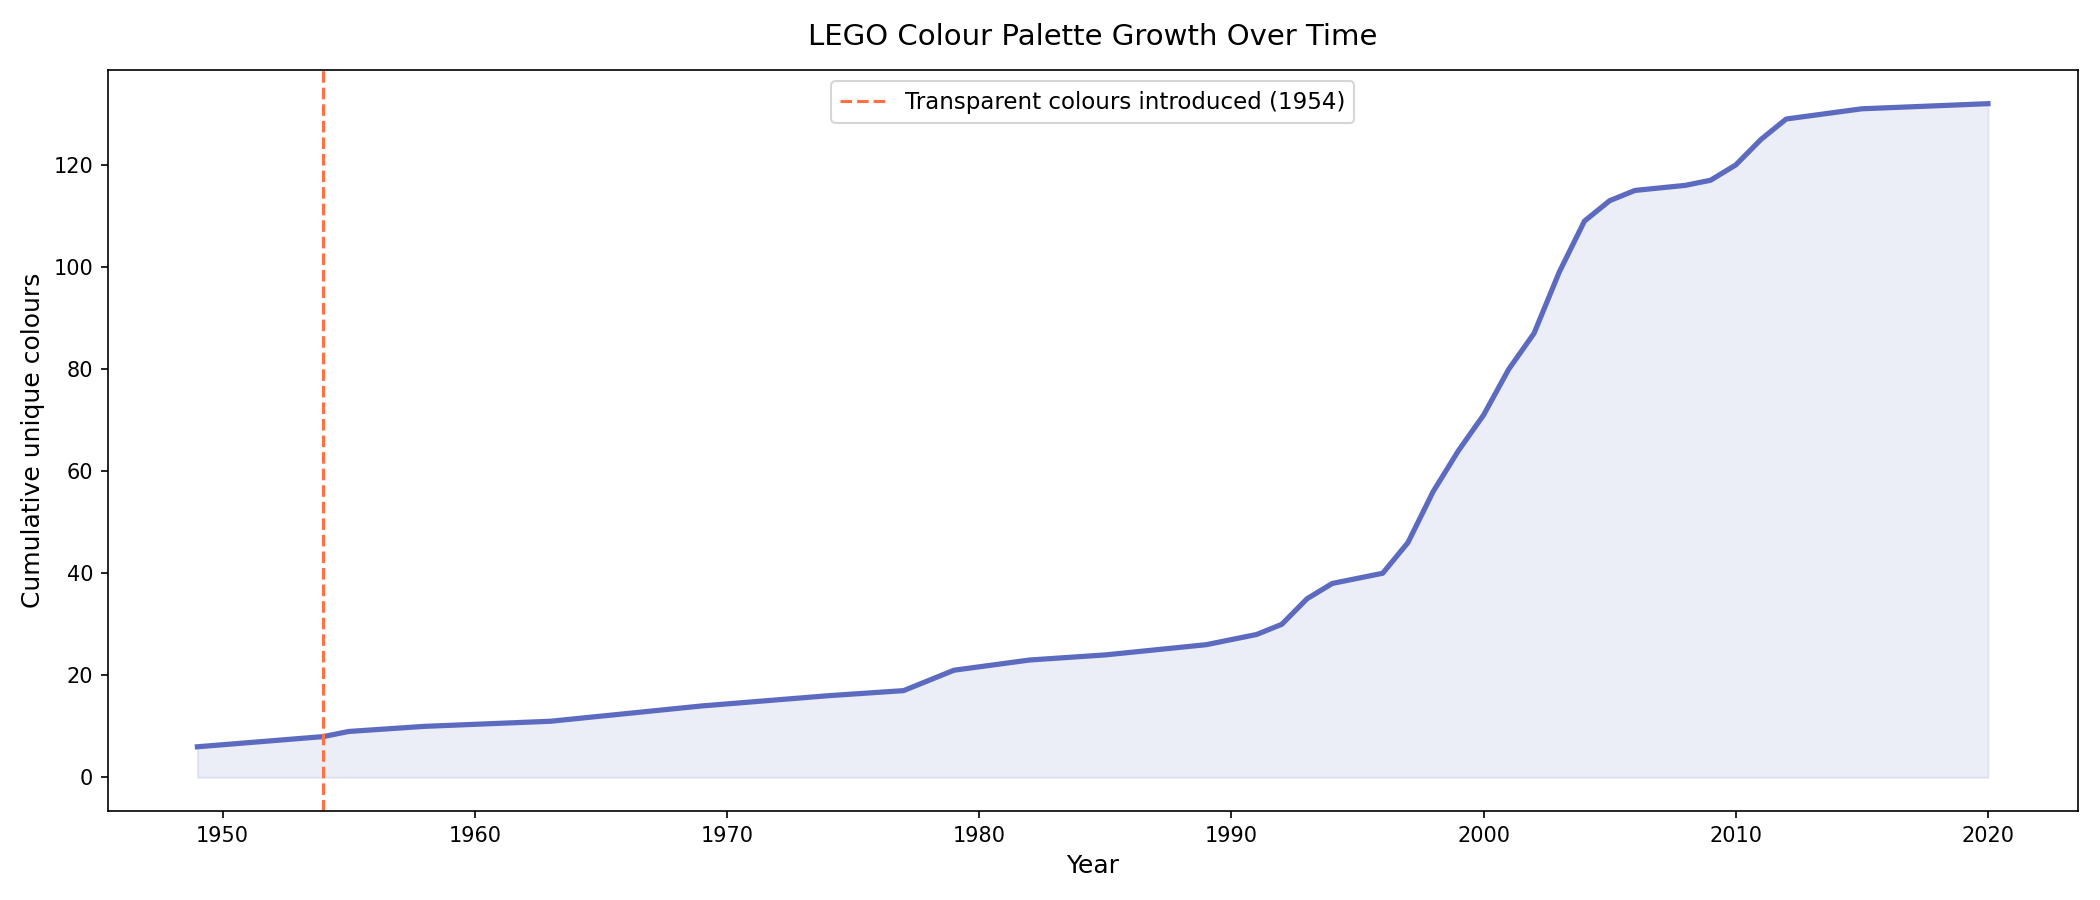
I found that the answer is both. Licensed share grew from 0% to 31.5%. Average parts per set grew 8×. Minifigure density rose 57% between the 1970s and 2010s. The colour palette tripled in the 2000s alone. Those trends don't move independently — they move together, and they move from 1999. In conclusion, the franchise deals didn't just add licensed sets to the catalogue; they changed the economics and character of the entire product line.
Quick Facts
Overview
Problem
The business narrative around LEGO's turnaround is well documented, but I couldn't find anyone who had actually quantified the product-level shift. I wanted to know: did Star Wars and Harry Potter change what LEGO builds — complexity, colour, character focus — or did they simply add volume to a catalogue that was otherwise unchanged? Answering that meant joining a six-table relational schema across 70 years of data and measuring multiple dimensions simultaneously.
Solution
I built six analyses to triangulate the answer. The analytical work involved:
- Joined six relational tables across 70 years of product history to connect sets, themes, colours, inventories, and minifigure records
- Manually audited all 596 themes to build a ground-truth licensed IP classification — rejected automated string matching because licensed themes appear scattered under non-licensed roots in the hierarchy, making any automated approach silently unreliable
- Recursive function to resolve a self-referential parent/child theme hierarchy, walking each theme to its root before aggregating set counts across all descendants
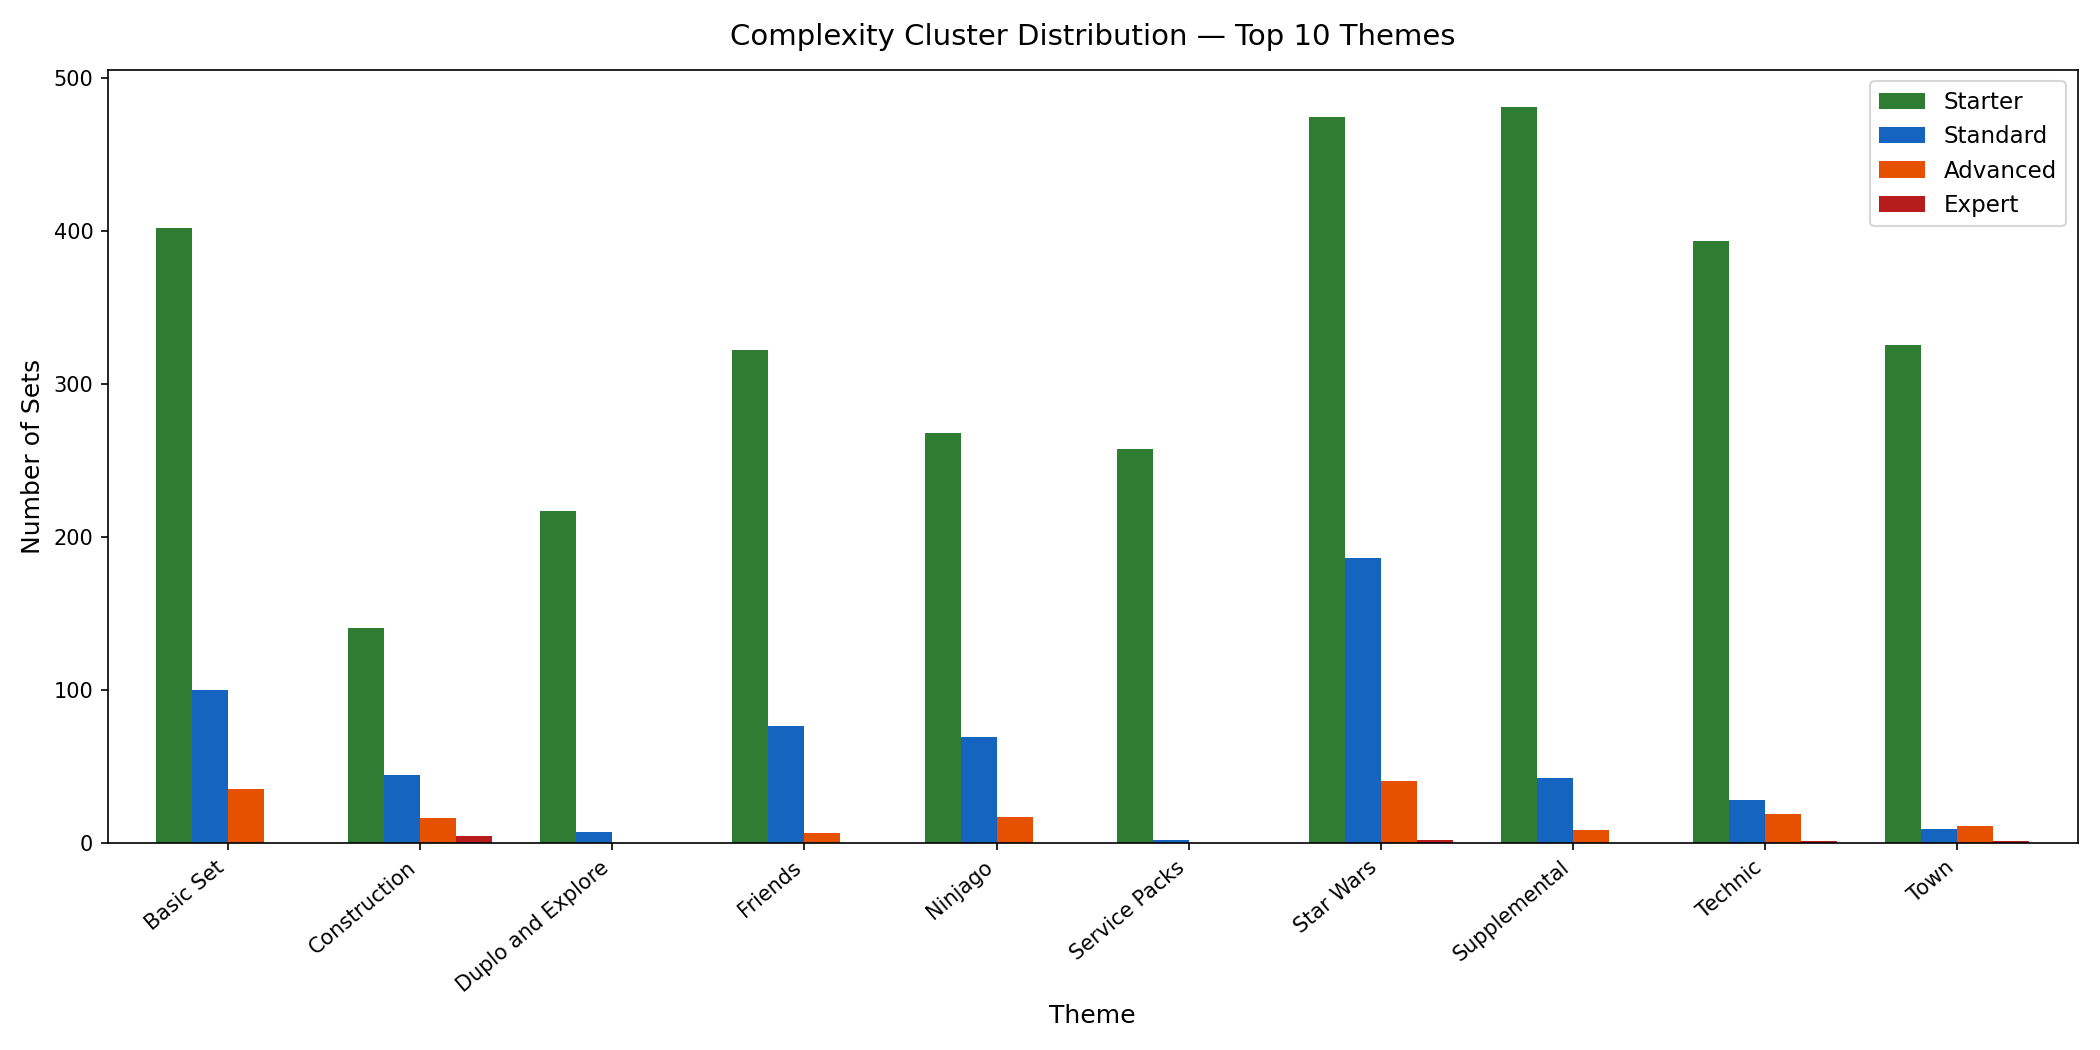
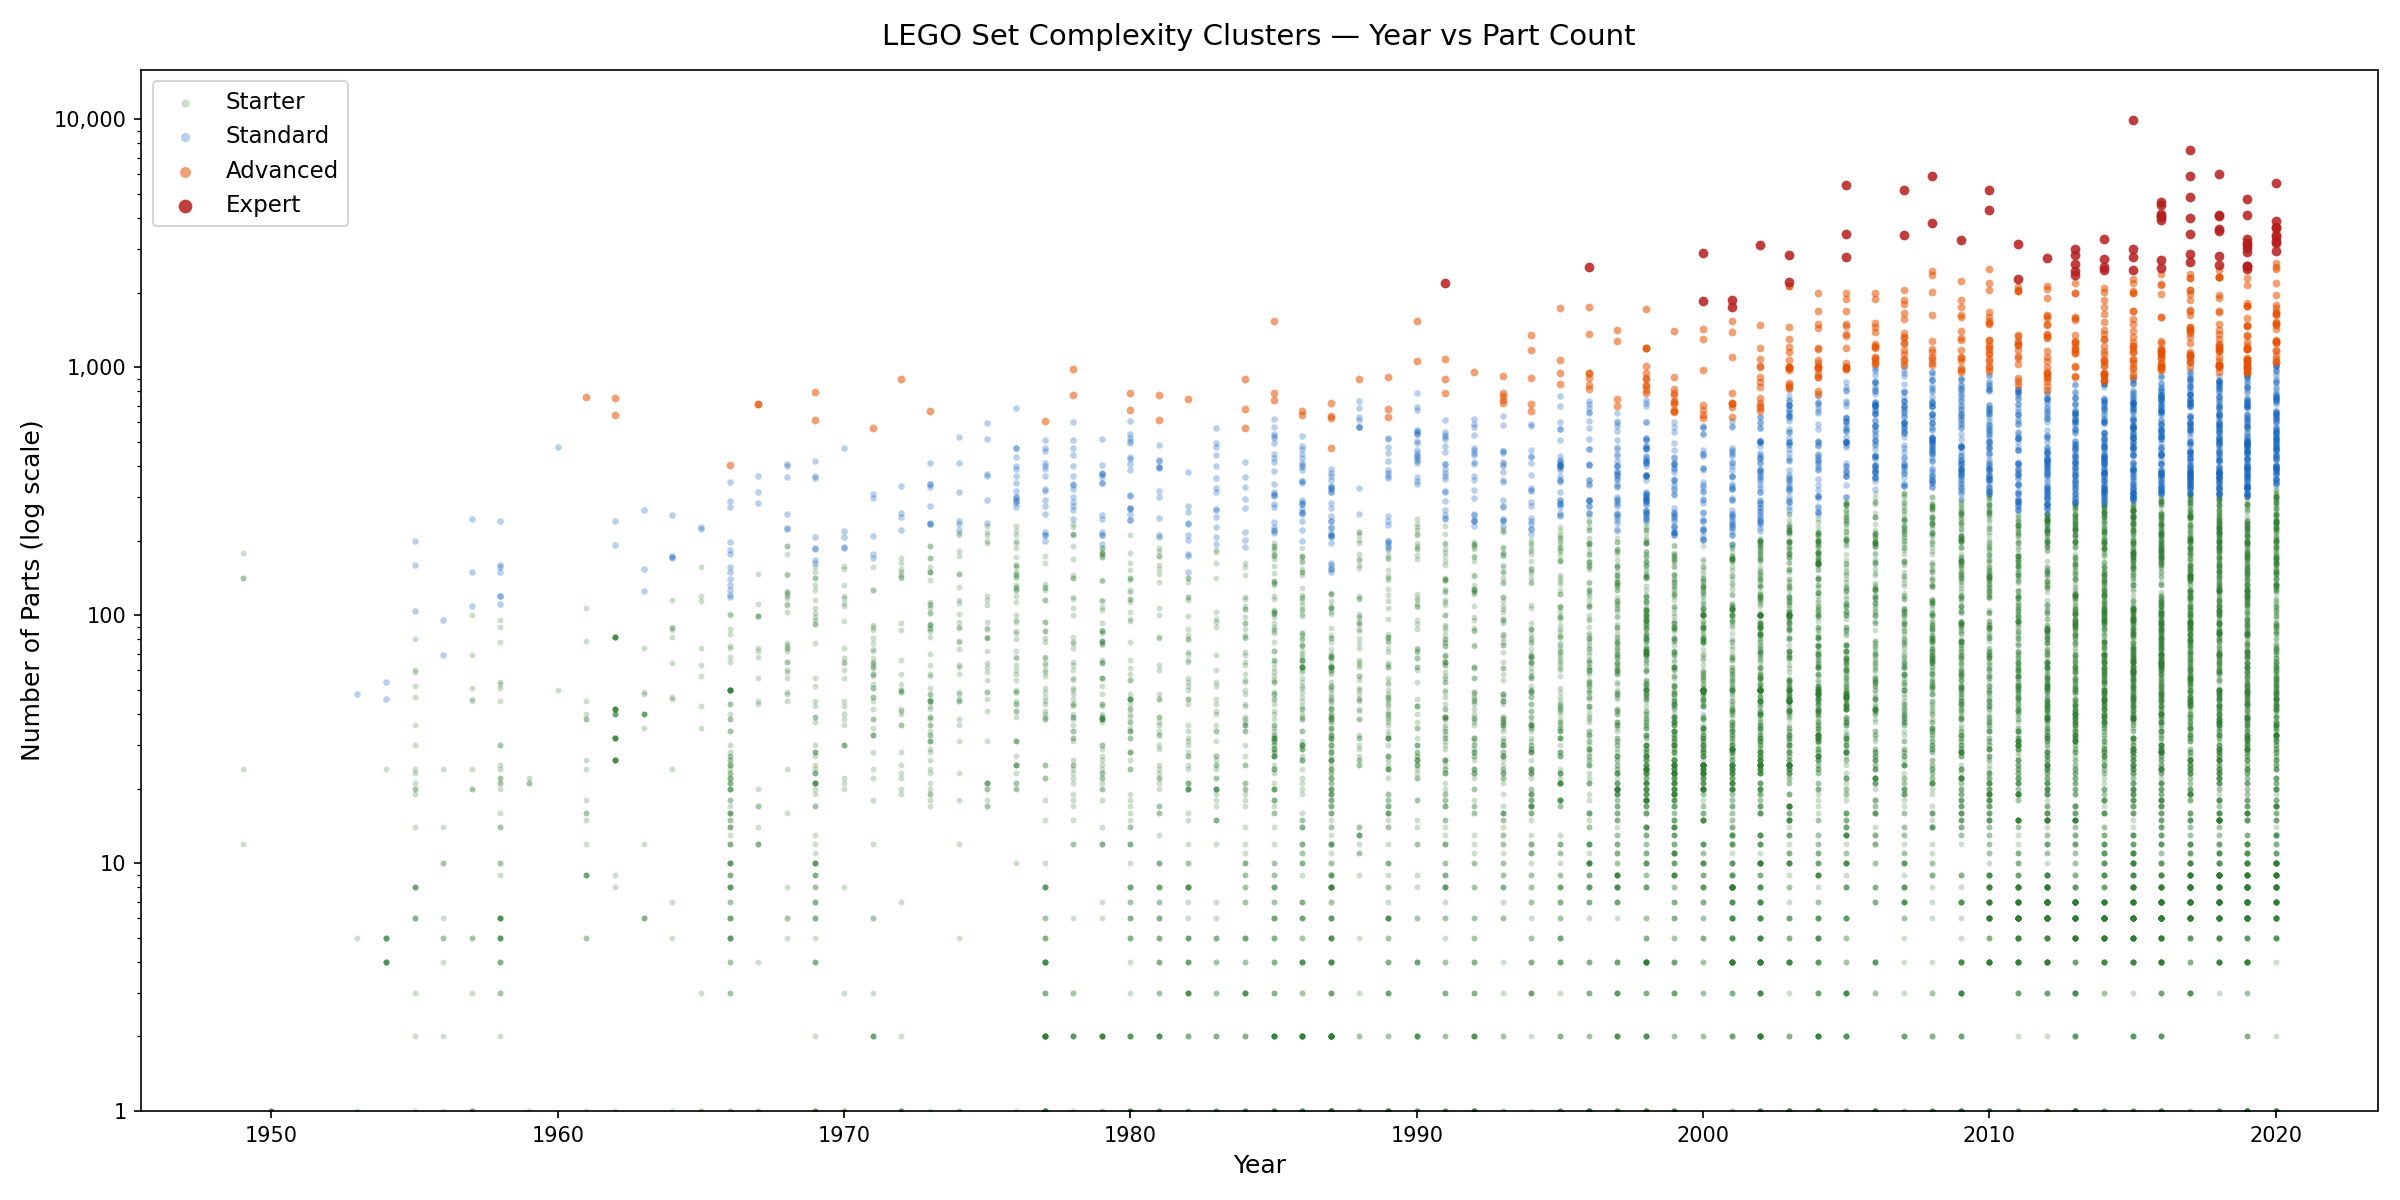
- K-Means clustering segmenting 15,710 sets into four complexity tiers (Starter, Standard, Advanced, Expert) using part count and era-relative complexity
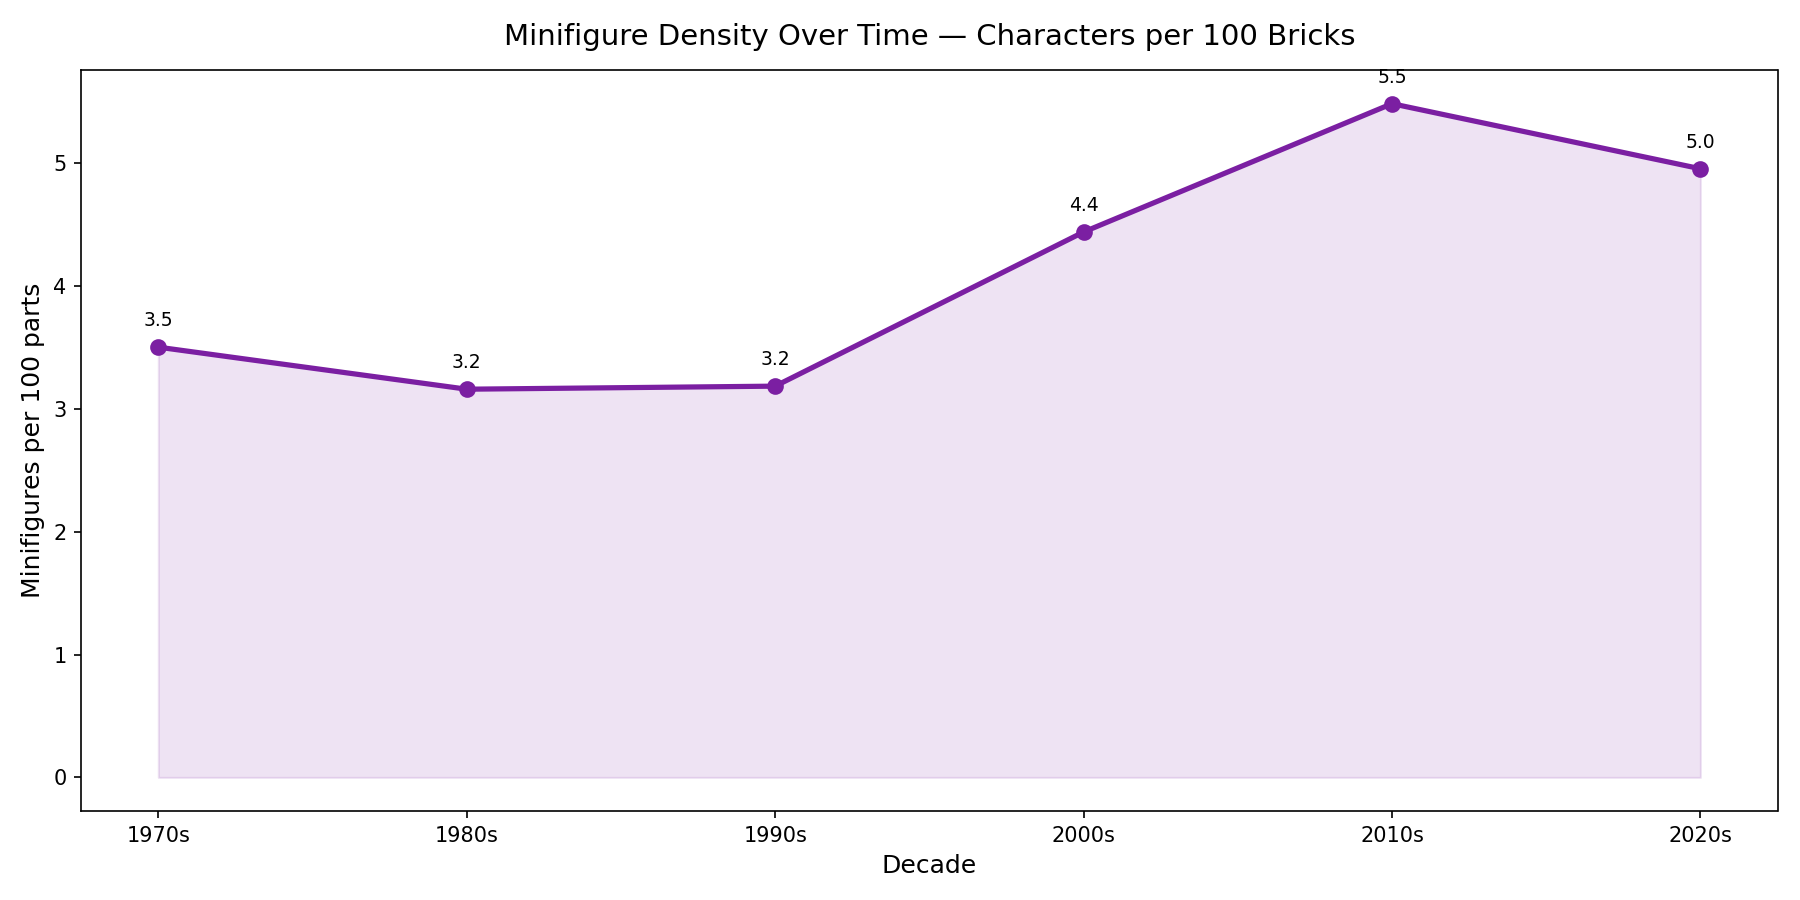
- Minifigure density measured as unique character types per set — not raw quantity, which is inflated by bulk packs
- 122MB inventory file handled with gzip decompression at runtime, reading only the columns needed to keep memory manageable
The ground-truth CSV for licensed IP classification is a fully auditable, versioned data asset committed to the repository — every claim in the analysis traces back to it.
Challenges
The self-referential theme hierarchy was the first structural problem I hit. themes.csv uses a parent_id that points back to the same table, so I needed a recursive function to walk each theme to its root before I could aggregate set counts correctly.
Licensed IP classification took the most deliberate effort. I initially tried to automate it and quickly realised it couldn't be done reliably — licensed themes appear scattered across the hierarchy under non-licensed roots. I ended up manually reviewing all 596 themes and building a ground-truth CSV. It was time-consuming but it meant every claim in the analysis is backed by an auditable source.
inventory_parts.csv decompresses to 122 MB, which was too large to commit raw. I committed the .gz (13 MB) and decompressed at runtime, reading only the columns I needed to keep memory manageable.
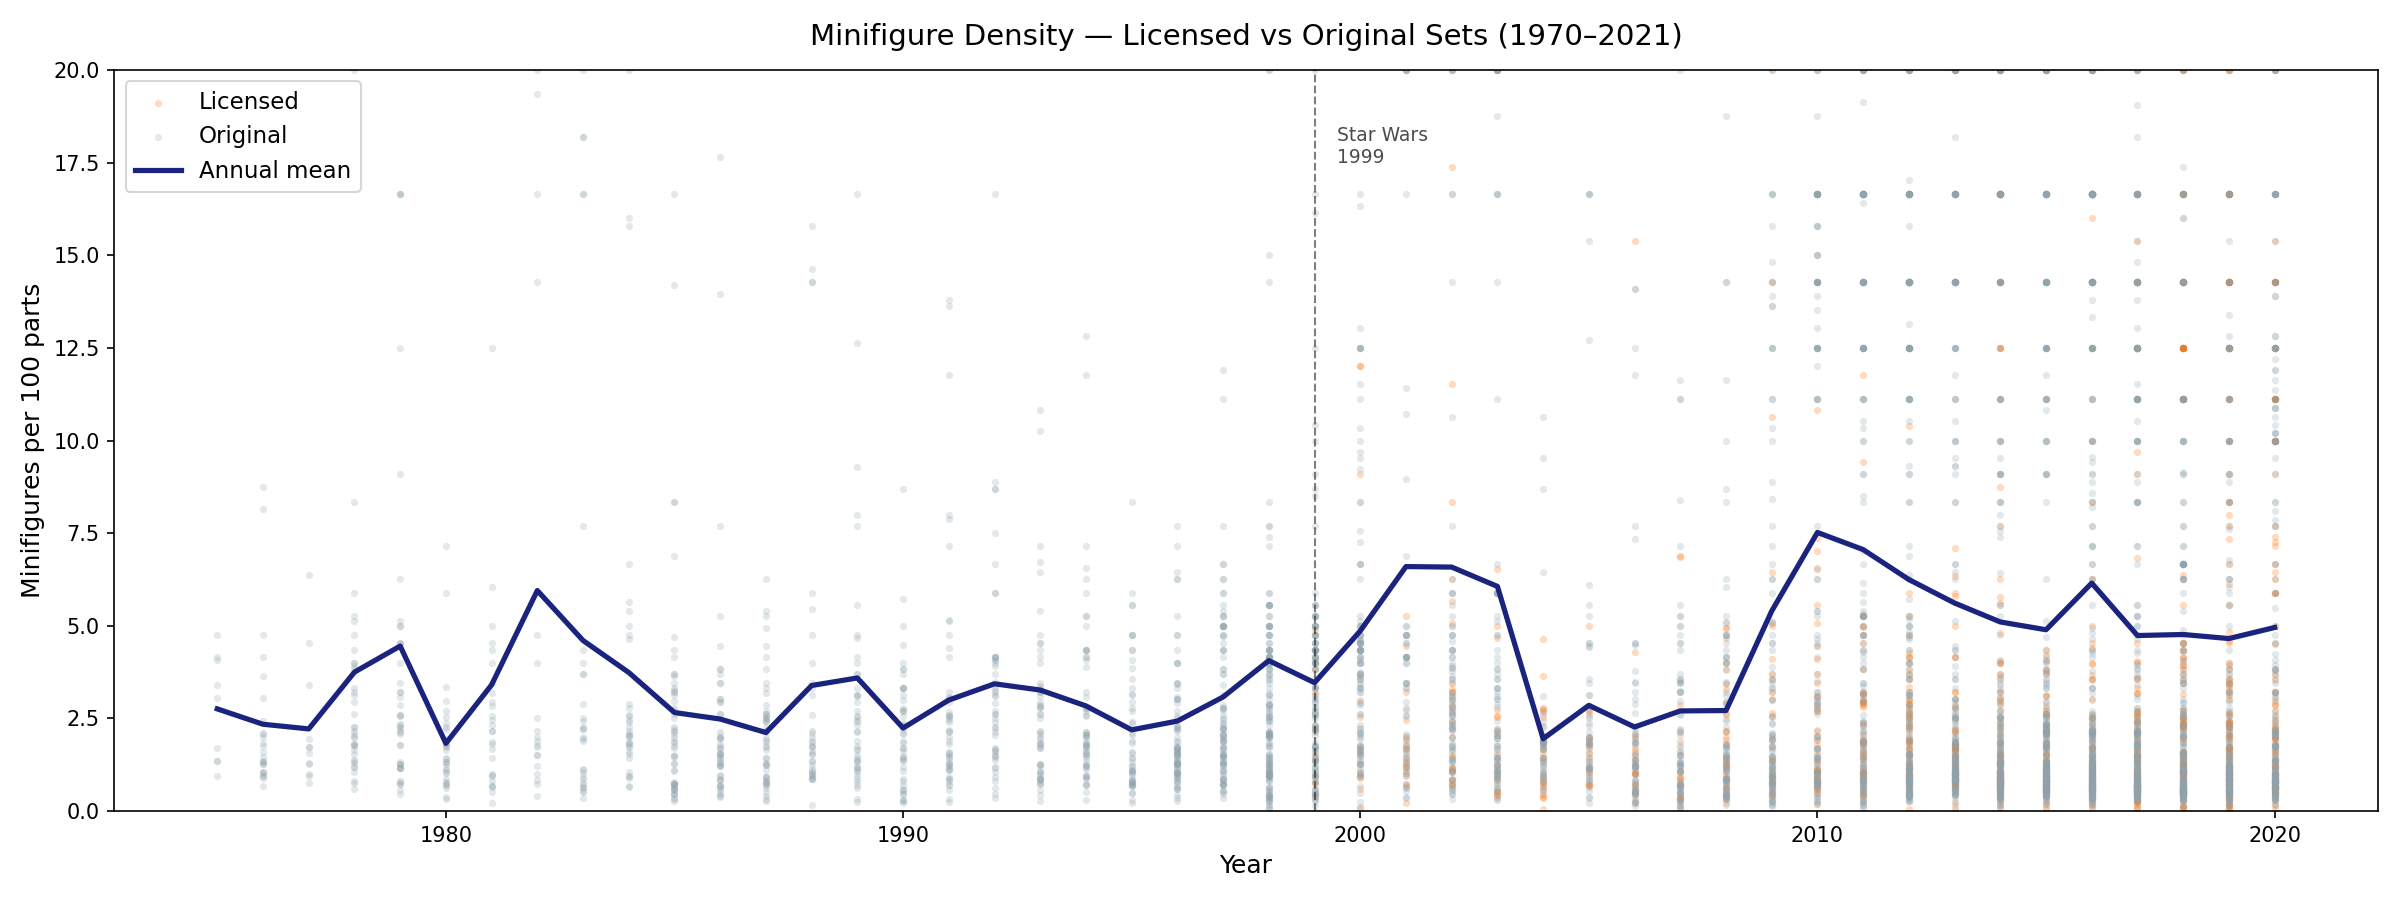
For minifigure density I had to be careful about what I was measuring. Total figure quantity per set is inflated by bulk packs. What I actually wanted was unique character types — the distinct fig_num count per set — which is the meaningful signal for how character-focused a set is.
Results / Metrics
- Licensed share grew from 0% to 31.5% of annual releases (peaked 2019)
- Average set complexity grew 8× from 32 parts (1950s) to 259 (2020s)
- Minifigure density up 57% from 3.5 per 100 parts (1970s) to 5.5 (2010s)
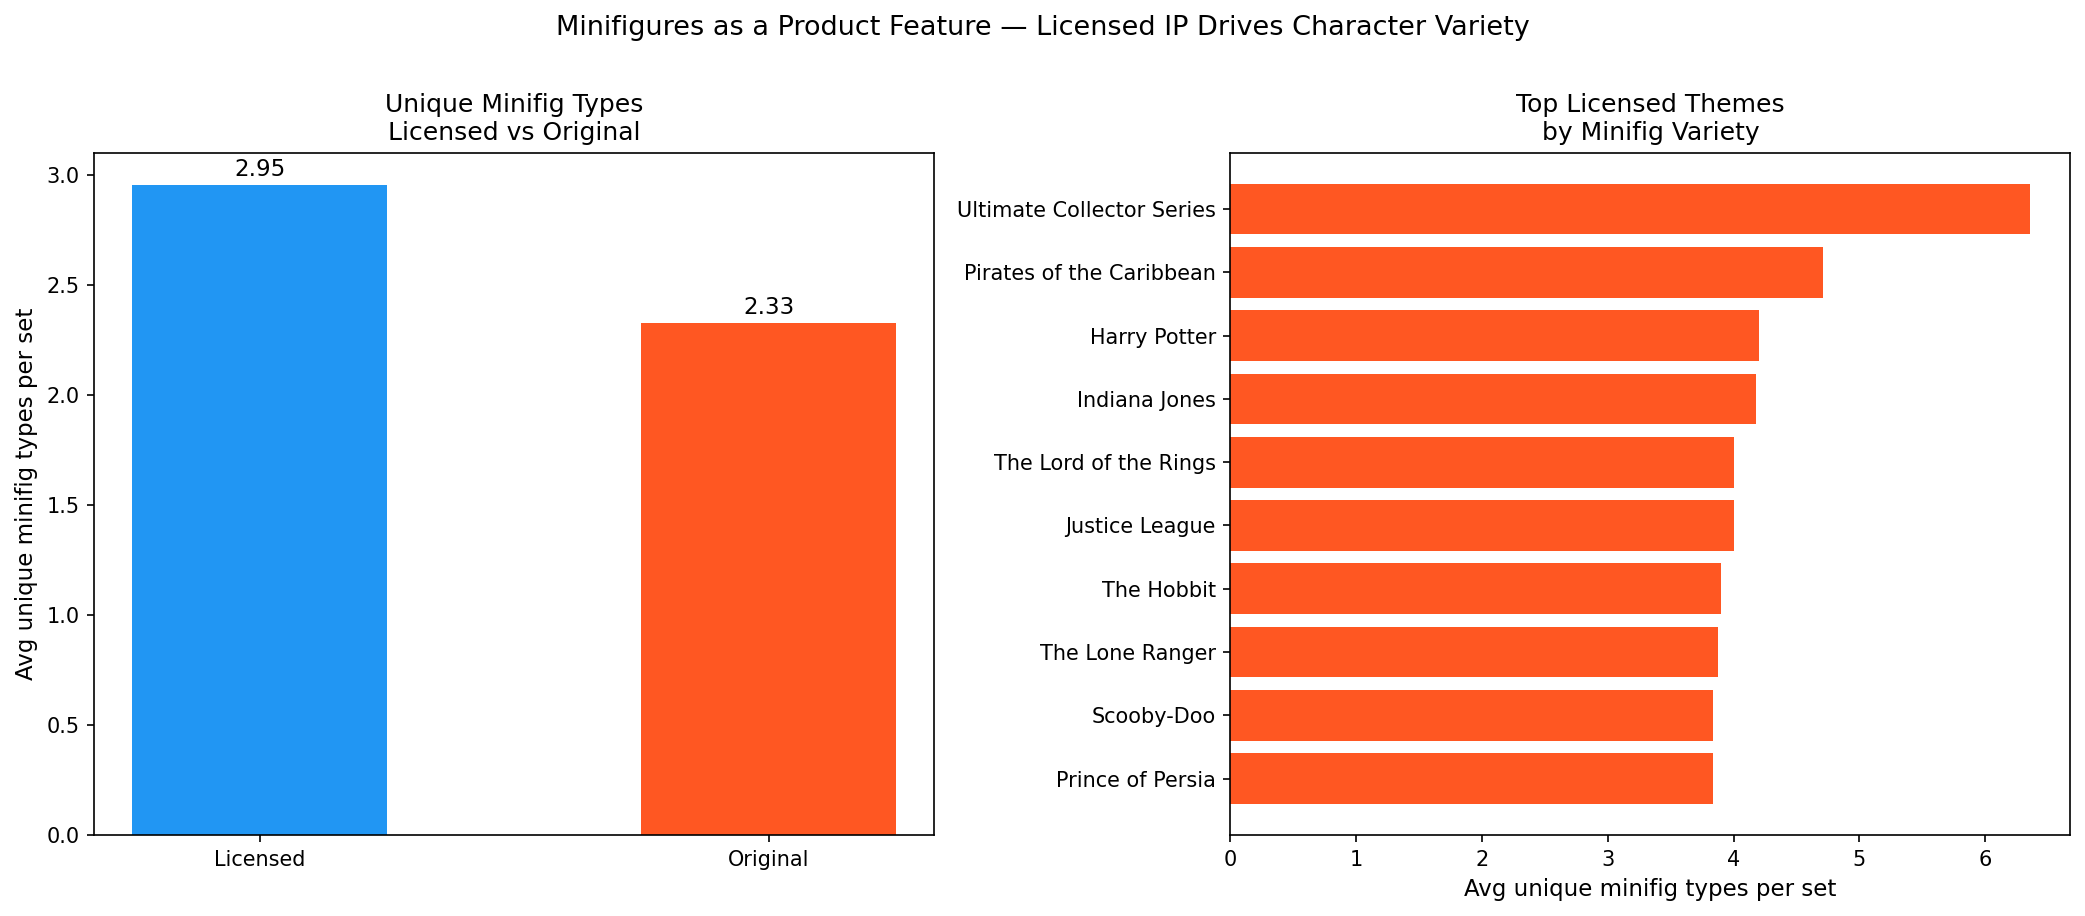
- Licensed sets are 27% more character-dense than original IP (2.95 vs 2.33 unique fig types per set)
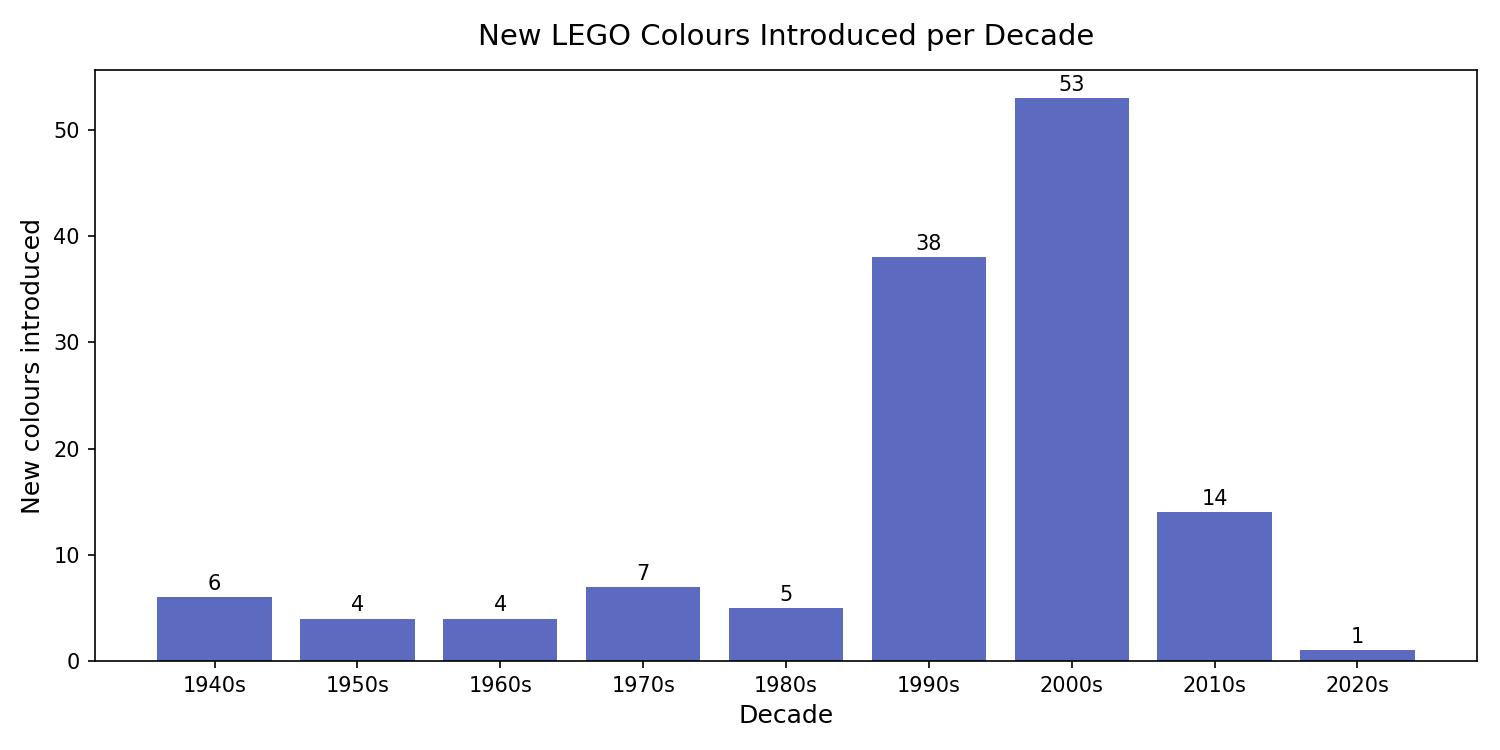
- 53 of 132 production colours introduced in the 2000s alone — more than the preceding five decades combined
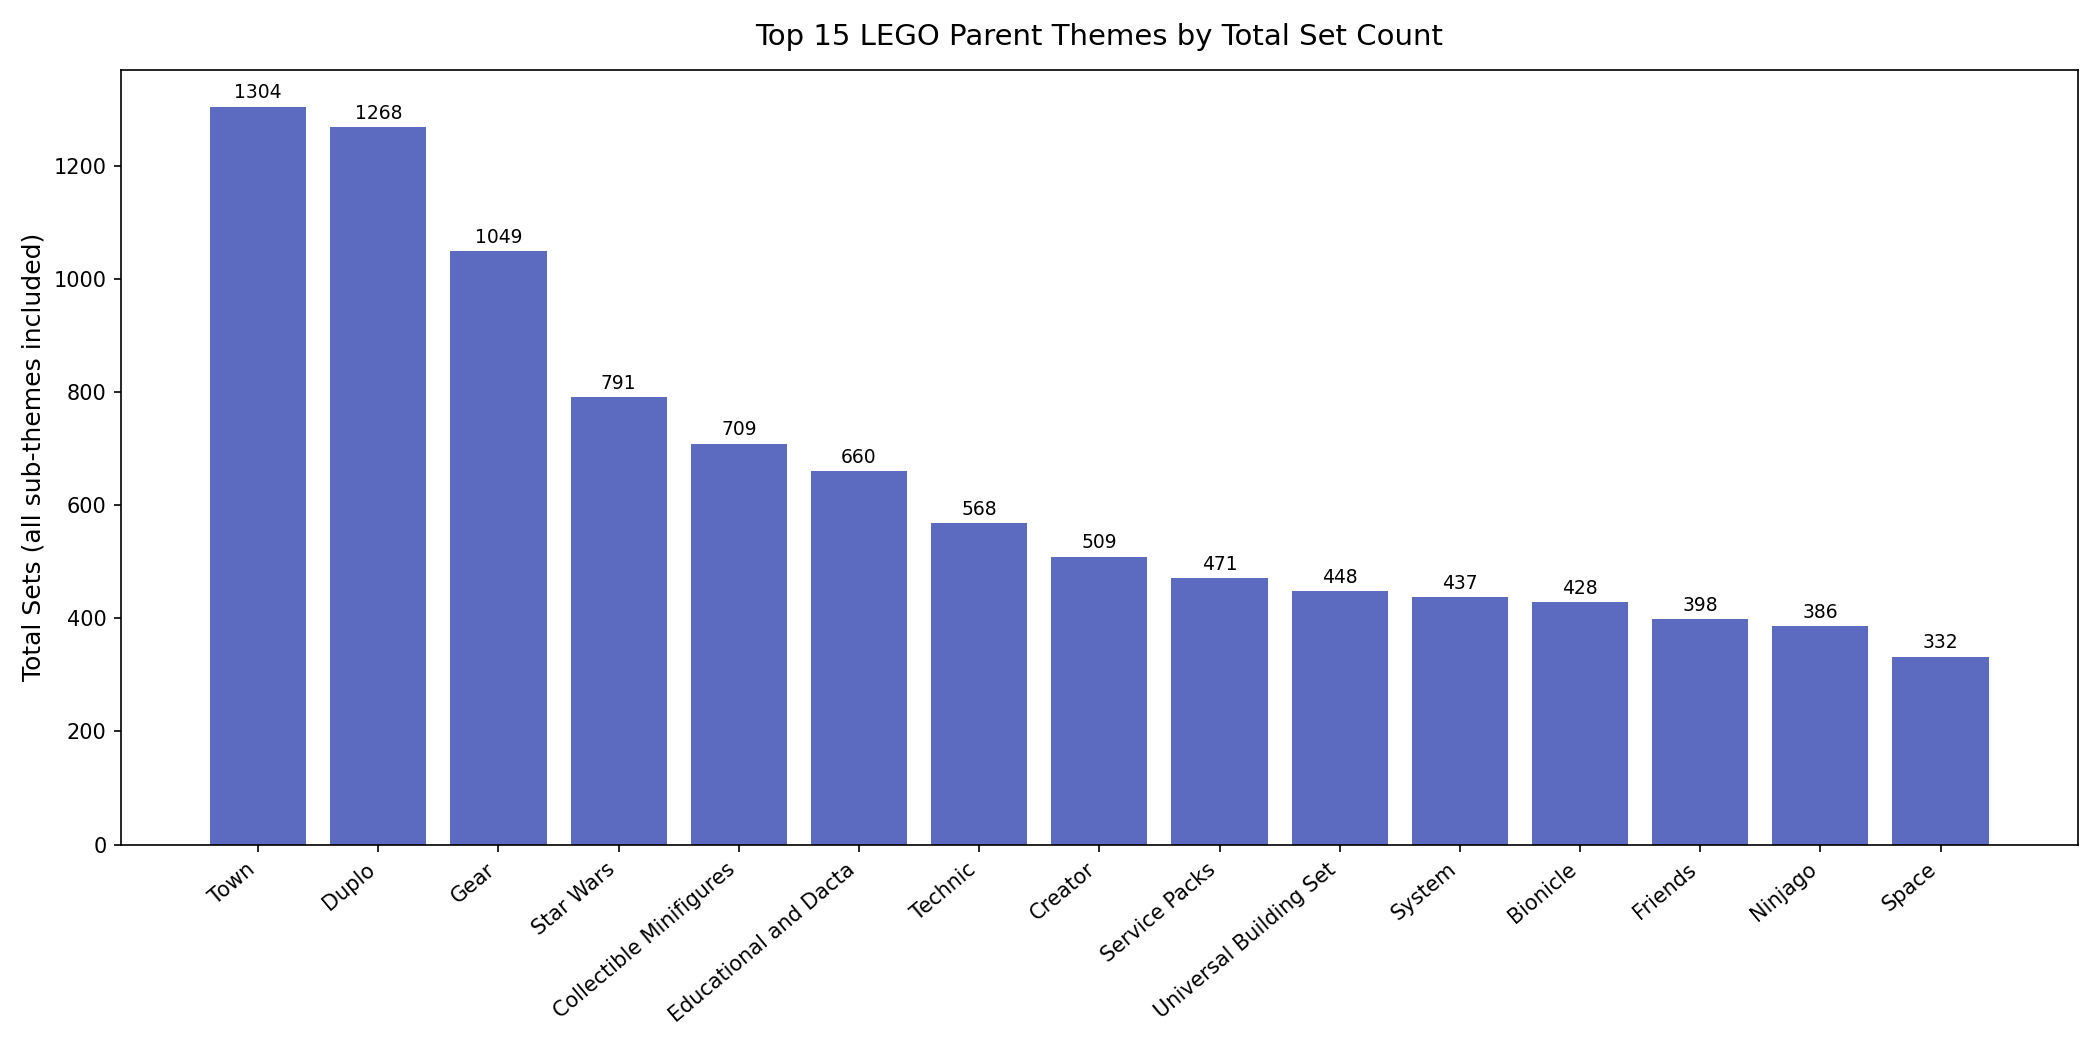
- Star Wars is the largest licensed franchise with 776 sets across all theme registrations
- Among multi-set franchises: UCS leads at 6.4 unique fig types per set, Pirates of the Caribbean 4.7, Harry Potter and Indiana Jones 4.2
- Town is the largest parent theme with 1,304 cumulative sets; theme hierarchy reaches a maximum depth of 2 levels
- CI/CD pipeline via GitHub Actions — rendered notebook auto-publishes to GitHub Pages on every commit, no code visible
Screenshots
Click to enlarge.
Click to enlarge.
Videos
No videos available yet.