Log Monitor — Health Check & Anomaly Detection
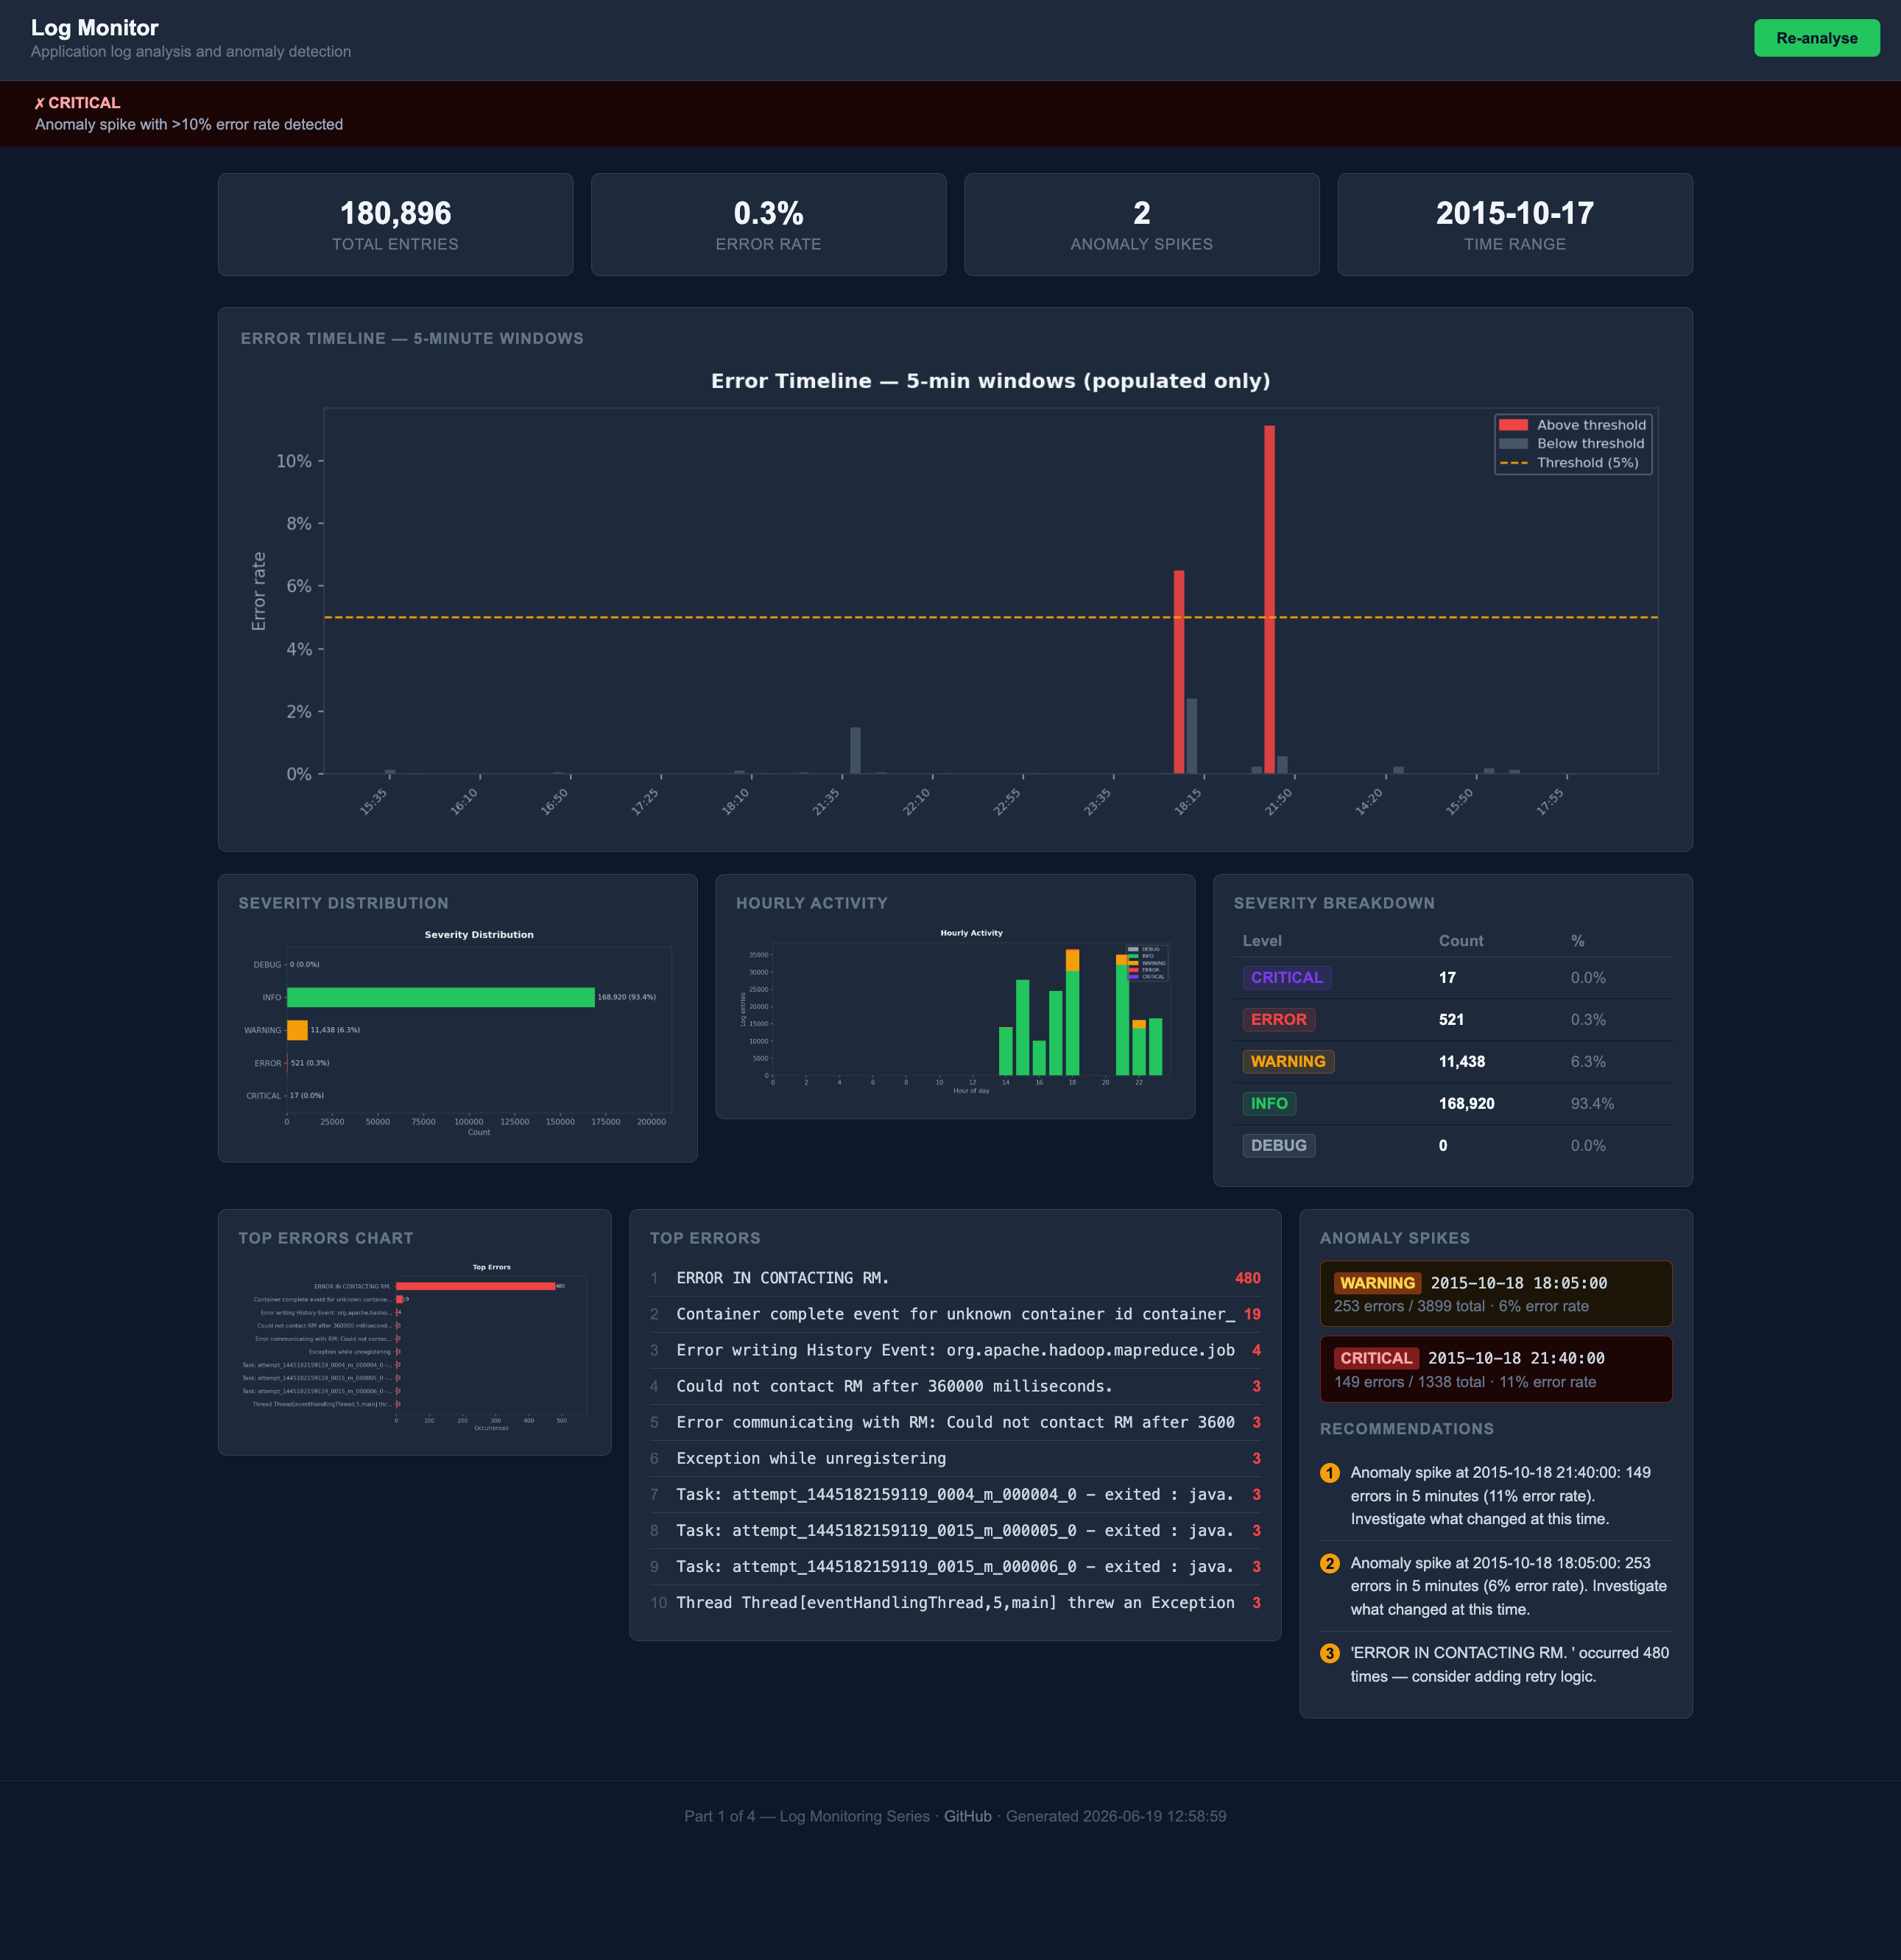
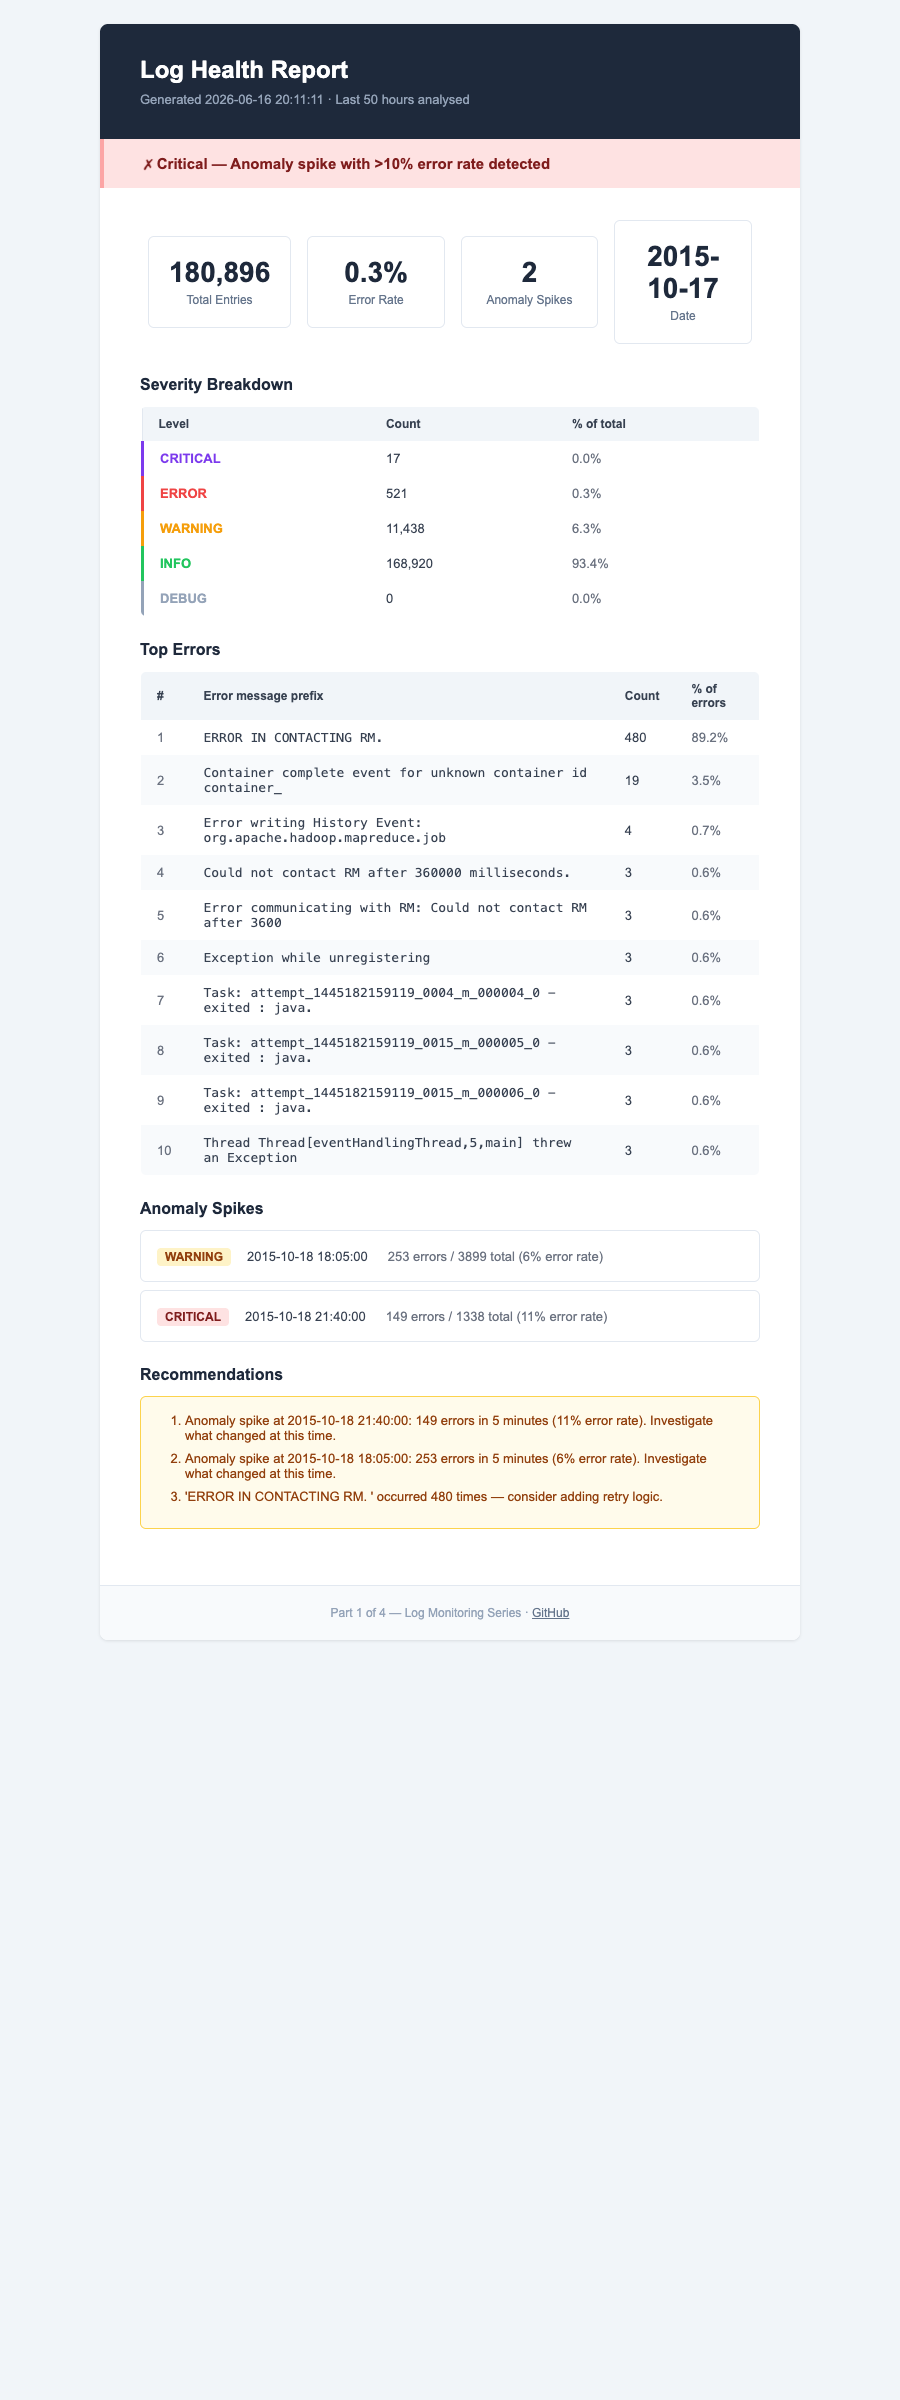
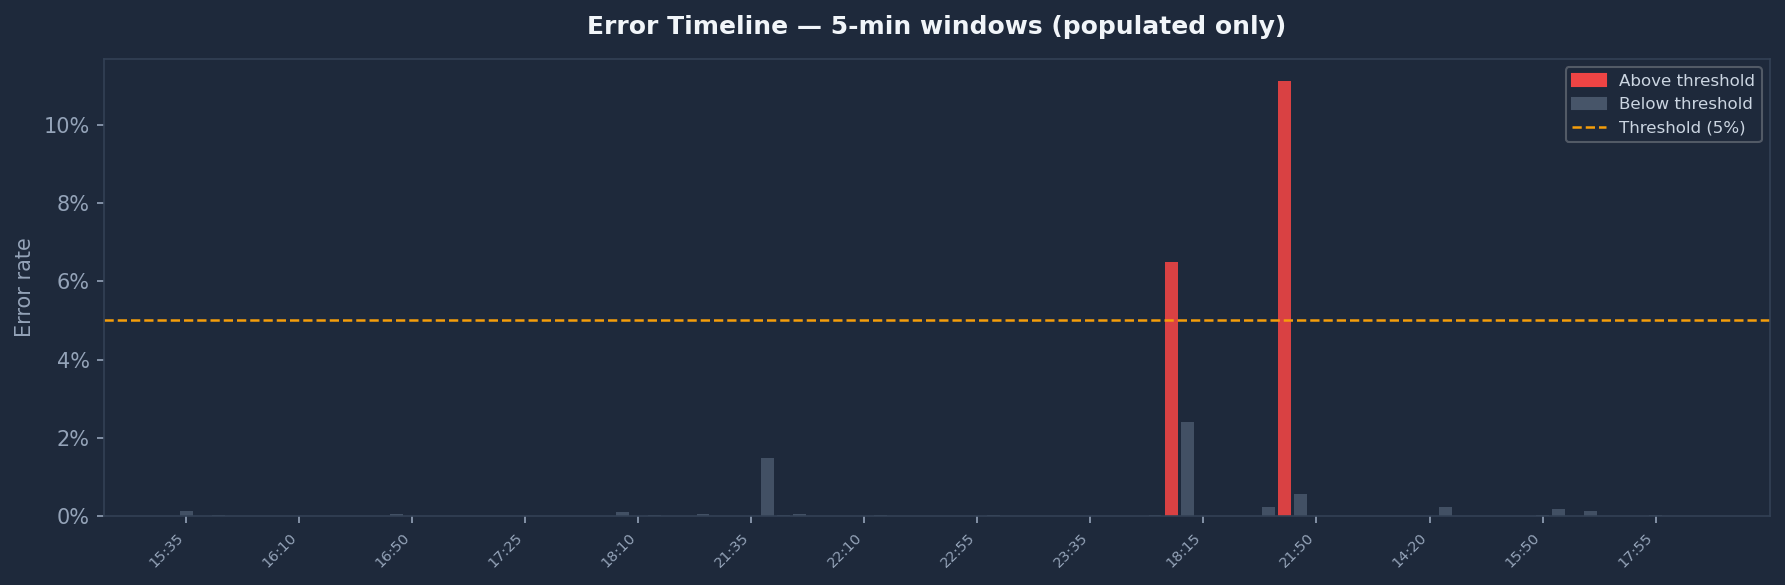
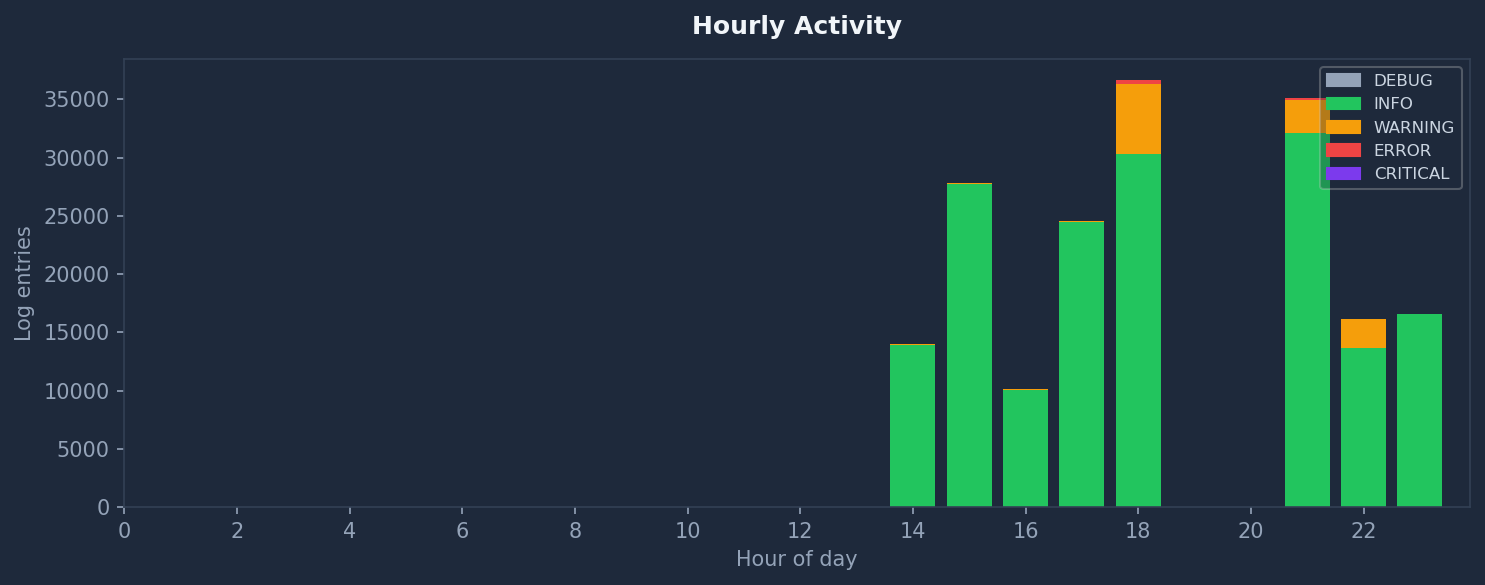
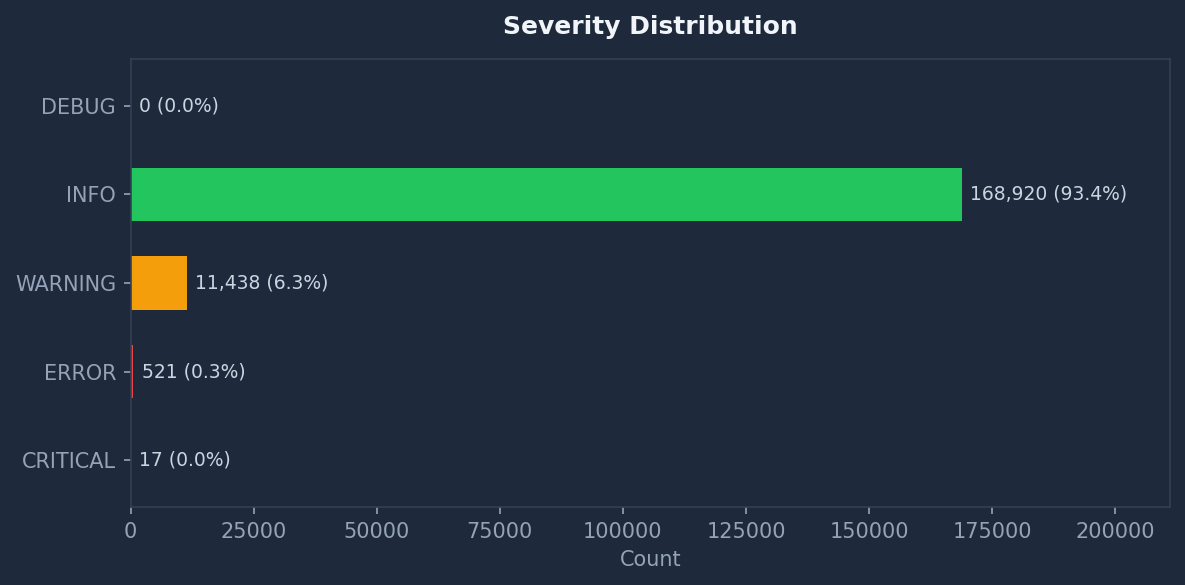
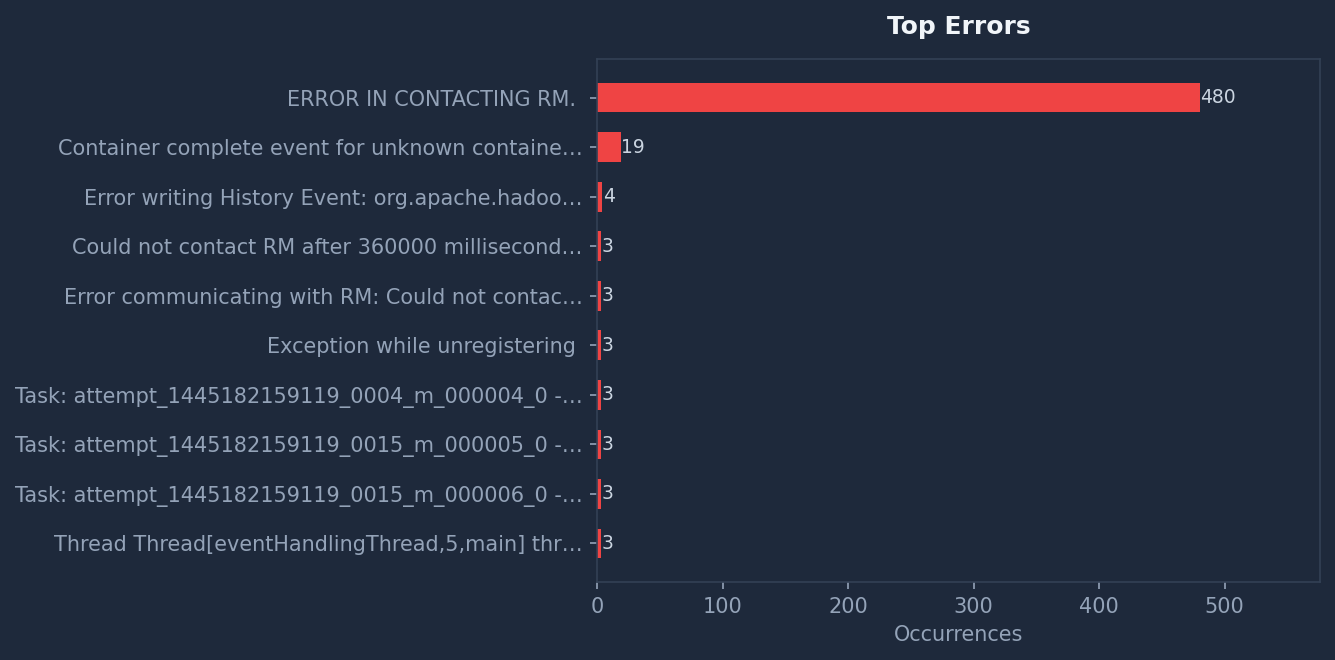
A Python pipeline built on the LogHub Hadoop corpus — 180,896 real YARN container log entries from a research cluster with labeled injected failures (machine down, disk full, network disconnection). hadoop_loader.py parses the Hadoop log format and maps Java levels to standard severity names. log_parser.py converts entries to a pandas DataFrame with derived minute_window and is_error columns for spike detection. analyser.py groups by 5-minute window and flags any window where error_count / total_entries exceeds 5% (critical at 10%), with a minimum window size filter to eliminate sparse windows. Two genuine anomalies are detected: a machine-down event at 11% error rate and a disk-full event at 6% — both 20-35x above the 0.3% baseline. Results are delivered three ways: a FastAPI dashboard with four Matplotlib charts, a scheduled HTML email via Gmail STARTTLS, and a Slack Block Kit alert with state-machine deduplication that fires only on status transitions. A GitHub Actions zipdeploy job for Azure App Service is included for self-hosting.
Quick Facts
Overview
Problem
Demonstrating production log monitoring skills relevant to a DevOps or data engineering role — real data ingestion, statistical anomaly detection, multi-channel alerting, and alert deduplication to prevent fatigue during sustained incidents.
Solution
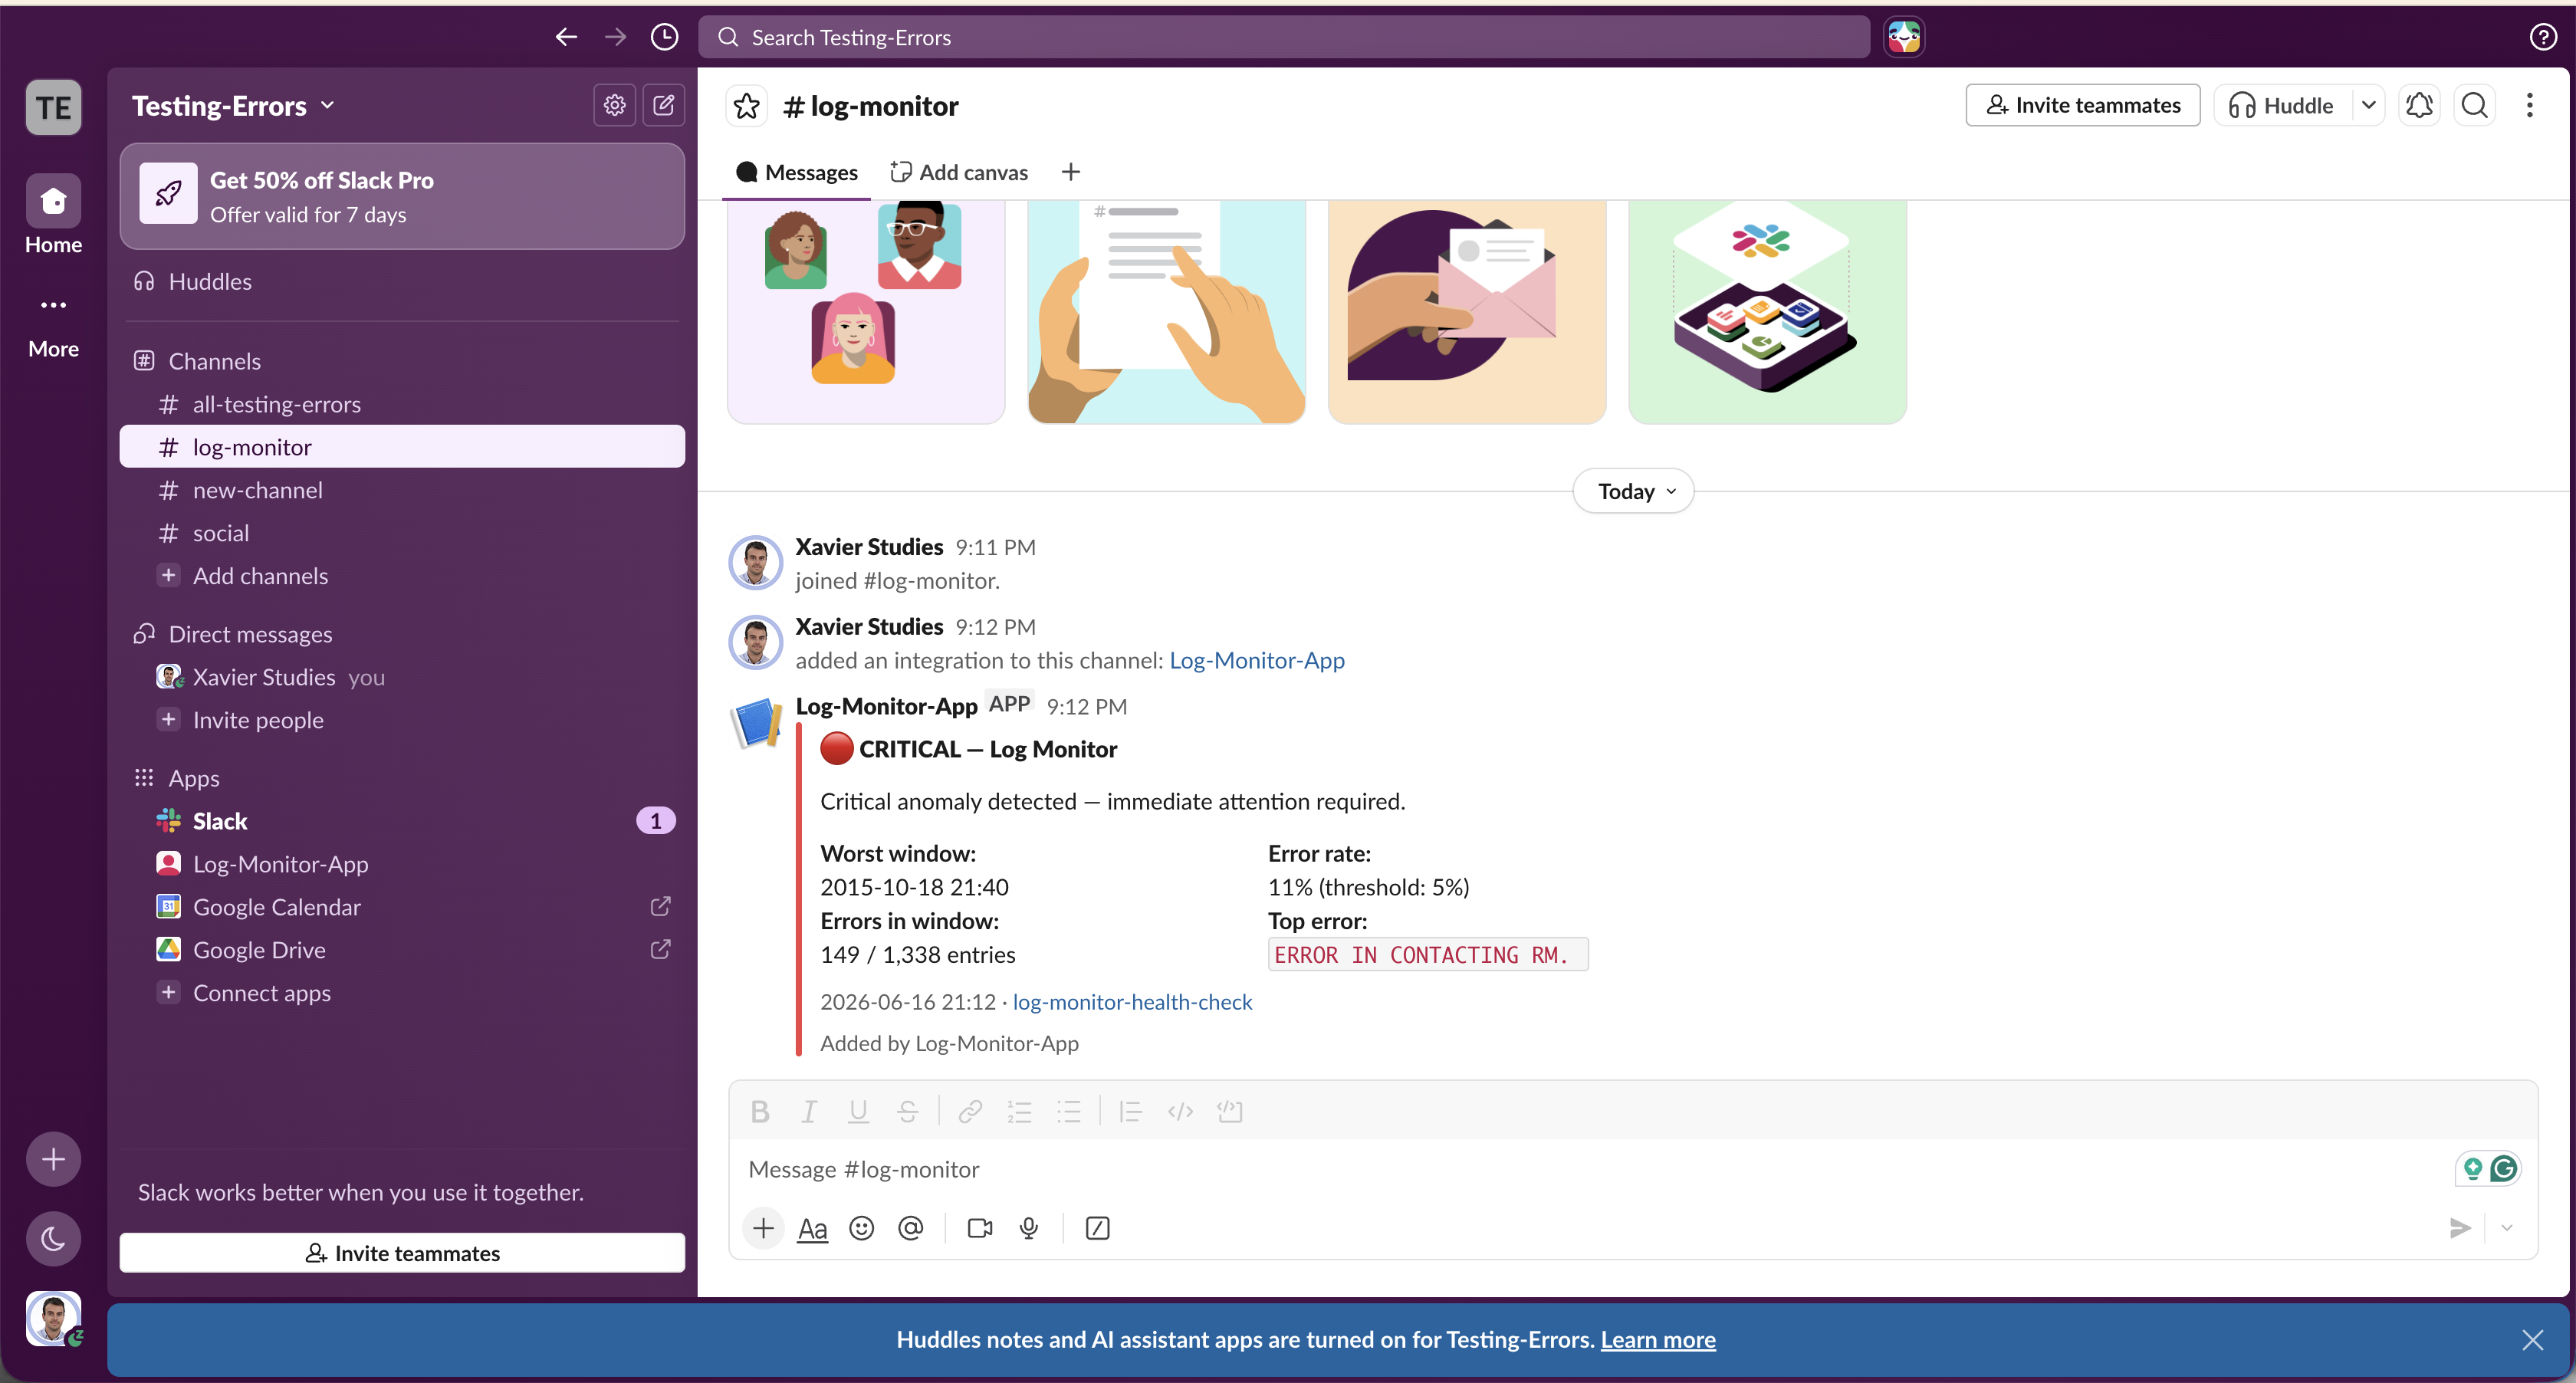
Rate-based spike detection (error_count / total_entries per 5-minute window) makes detection scale-invariant across varying log volumes. State machine via state.json fires Slack alerts only on HEALTHY/WARNING/CRITICAL transitions, not on every check. Three independent delivery paths (dashboard, email, Slack) share the same analysis pipeline. All credentials come from environment variables; config.yaml is gitignored.
Challenges
Real Hadoop data has a 0.3% baseline error rate — calibrating thresholds required inspecting the actual worst windows (11% and 6%) rather than guessing. Sparse windows near dataset boundaries produce artificially high error rates from too few entries, requiring the min_window_entries filter. Alert deduplication needed to survive process restarts, ruling out in-memory state in favour of a persistent JSON file.
Results / Metrics
Two genuine anomalies detected matching the LogHub labeled failure scenarios. 20 tests passing in CI with no dependency on the sample dataset. Daily cron downloads the Hadoop corpus, runs analysis, emails report, and posts Slack alert. Azure App Service deploy job included for self-hosting.
Screenshots
Click to enlarge.
Click to enlarge.
Videos
No videos available yet.