Movie Budget Linear Regression Analysis
Does spending more on a film reliably produce more revenue? This analysis fits a scikit-learn LinearRegression model on production budget versus worldwide gross for 5,384 released films spanning over a century of cinema. Before modelling, the pipeline cleans a currency-formatted dataset, removes 7 unreleased titles dated after the May 2018 data-collection cut-off, and creates decade buckets to enable era-level comparison.
The model explains 55.77% of the variance in worldwide revenue for films from 1970 onwards, with a slope of 3.12 — suggesting each additional dollar of budget is associated with roughly $3.12 in global box-office return. Despite this, 37.28% of all released films never recouped their production costs. The analysis also identifies 155 international releases (positive worldwide gross, zero domestic) and 357 films with no recorded revenue at all, including several carrying budgets above $60M.
Quick Facts
Overview
Problem
The film industry routinely allocates hundreds of millions of dollars to productions with uncertain returns. Understanding whether and to what degree production budget predicts box-office performance is a foundational question for any quantitative analysis of film economics. It also requires confronting a dataset that is riddled with data-quality issues — currency strings, unreported revenues, and future-dated entries — before any modelling can begin.
Solution
Data was loaded from a scraped CSV of 5,391 films and cleaned using a nested-loop approach to strip currency symbols from three monetary columns, followed by type conversion to float. Release dates were parsed to datetime and films dated on or after the May 2018 collection date were dropped. A decade column was derived via floor division to split the dataset into pre- and post-1970 cohorts. Linear regression was fitted using scikit-learn on the modern cohort, with Seaborn regplot overlays used to visualise the fit. The same regression was repeated on old films to surface differences in slope and R² across eras.
Challenges
The strongest analytical challenge was the large number of zero-revenue entries — 357 films with no worldwide gross at all. Distinguishing genuinely unreleased titles from films with missing data required filtering on the collection date rather than simply dropping zeros, since some zero-revenue rows represent international-only releases or streaming titles with no theatrical gross. The weak explanatory power for pre-1970 films (shallow slope, lower R²) also required interpretation: sparse data and fundamentally different distribution economics make direct comparison to the modern era misleading without acknowledging the structural differences.
Results / Metrics
- R² = 55.77%: production budget explains over half the variance in worldwide gross for post-1969 films
- Slope = 3.12: each additional dollar of budget is associated with ~$3.12 in worldwide revenue
- 37.28% of released films failed to recoup production costs from worldwide box-office revenue
- 357 films reported zero worldwide gross; highest-budget zero-earner carried a $175M budget
- 155 films earned international revenue while recording zero domestic (US) gross
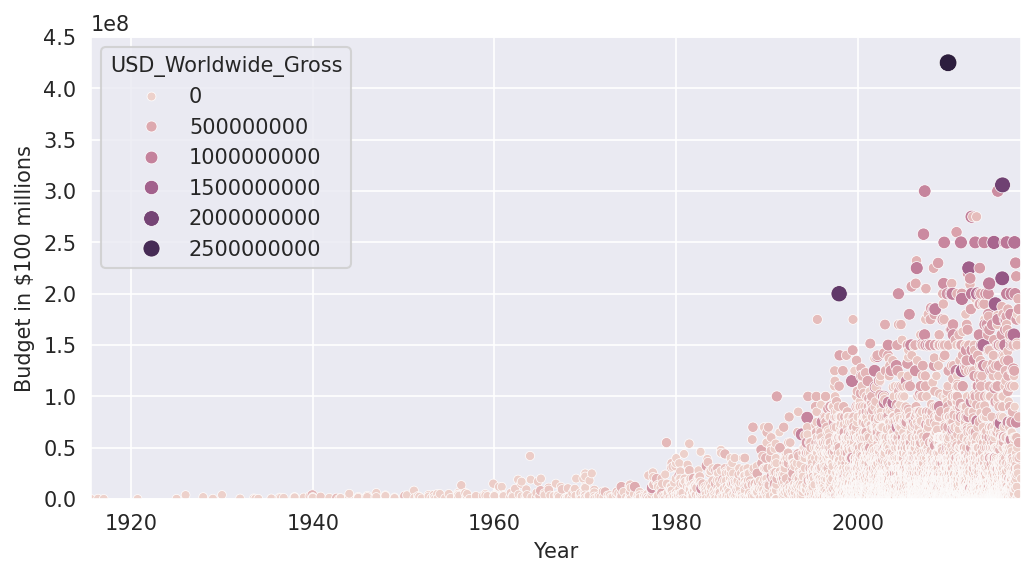
- Avatar: $425M budget → $2.78B worldwide gross, the dataset's highest earner
- Pre-1970 regression slope ≈ 1.65 vs 3.12 for modern films — a weaker and shallower relationship
Screenshots
Click to enlarge.
Click to enlarge.
Videos
No videos available yet.