Nobel Prize Data Analysis
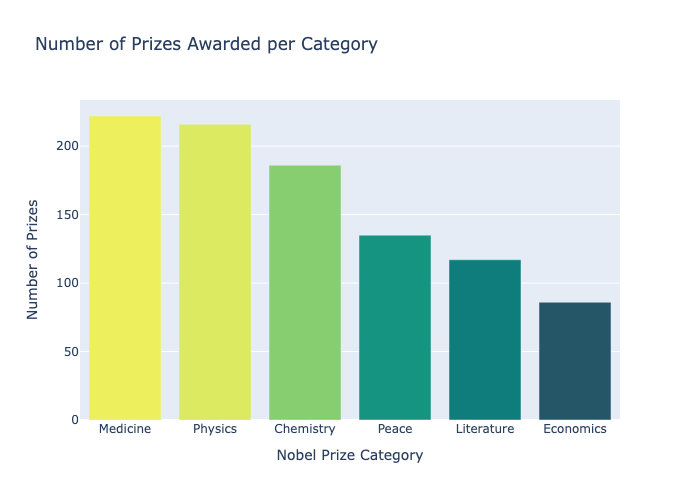
I dug into a dataset of Nobel Prize laureates going back to 1901 to answer questions about the famous prize and its history: how many women have actually won, which countries dominate, and whether scientists are getting older when they finally receive the prize. The analysis spans gender breakdowns, country rankings, research institution hotspots, and age distributions across all six prize categories. It uses Plotly for interactive charts, Matplotlib for trend overlays with rolling averages, and Seaborn for statistical visualisations. It's a thorough end-to-end pandas project — from raw CSV to interactive insight.
Quick Facts
Overview
Problem
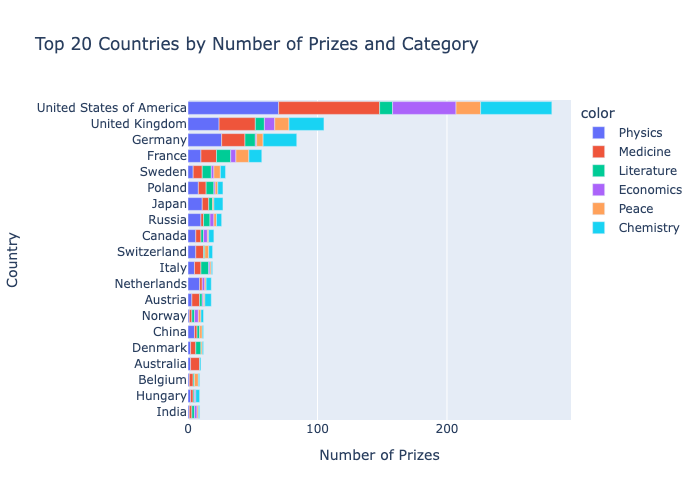
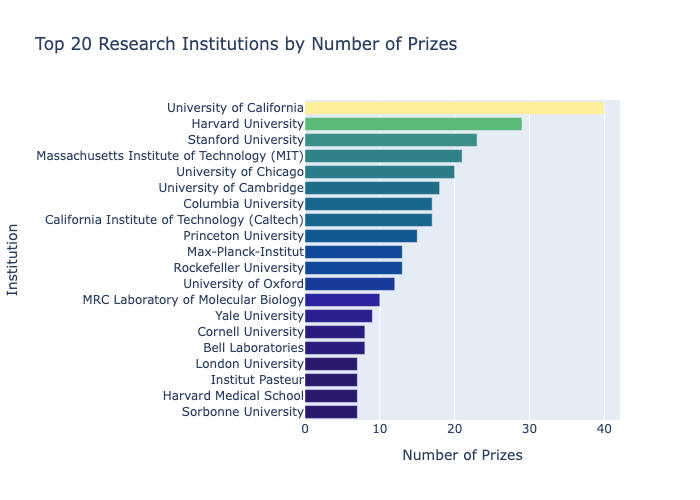
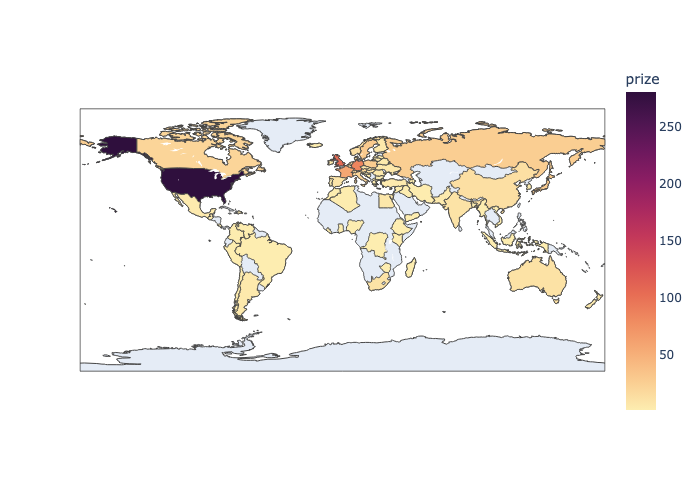
A raw dataset of 1,000+ Nobel laureate records going back to 1901 doesn't tell you much on its own — the interesting patterns are buried across decades, categories, and geographies. I wanted to answer specific questions: when did the US start dominating, which organisations produce the most laureates, are prizes going to older scientists now than a century ago? Without proper aggregation and visualisation, those questions are impossible to answer by eye. The dataset also has quirks — birth countries that no longer exist, missing dates, organisations only relevant to certain categories — that need careful handling before any analysis is meaningful.
Solution
I loaded the CSV with pandas and worked through a cleaning pass: converting birth dates to datetime, parsing the fractional prize share into a float percentage, and computing each laureate's age at the time of the award. Aggregations used groupby with various functions, cumulative sums for the country race chart, and 5-year rolling averages for the trend overlays. Plotly Express handled the interactive charts (donut, bar, choropleth, sunburst, line), Matplotlib added dual-axis scatter and line charts, and Seaborn produced the statistical visualisations (histplot, regplot with LOWESS, boxplot, lmplot). Keeping everything in a single practice notebook made it easy to follow the full analysis from start to finish.
Challenges
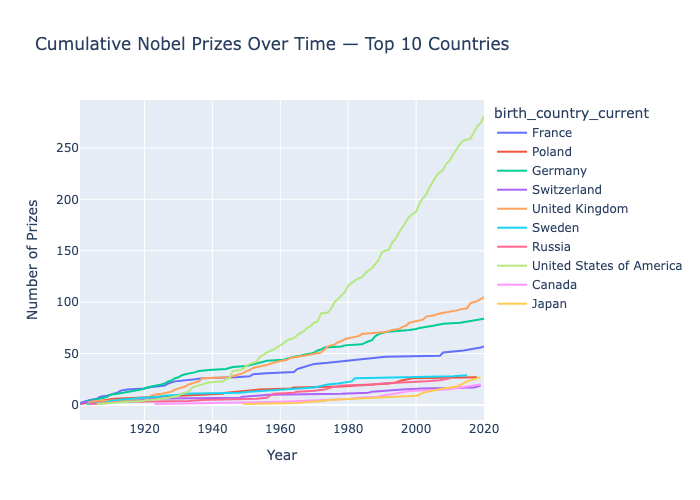
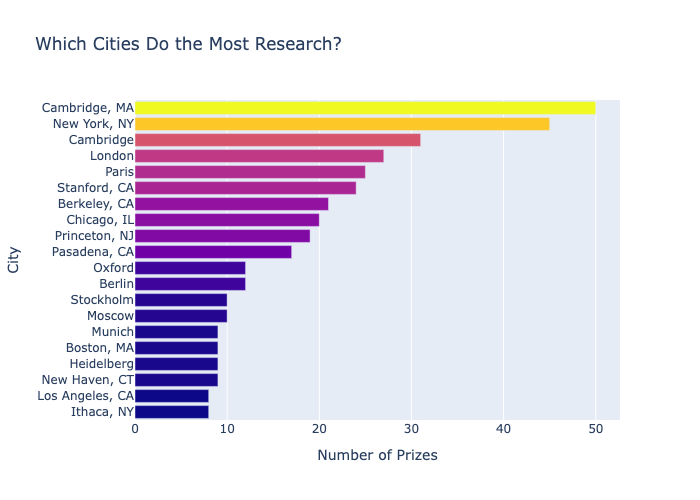
The trickiest part was the cumulative country race chart — it required grouping by both country and year, computing a running total within each country group, then filtering to the top 10 by final count. Getting the groupby and cumsum to produce the right shape without duplicating rows took a few attempts. The dual y-axis Matplotlib chart was also fiddly: inverting the secondary axis so that a rising prize-sharing trend reads as a downward visual movement required careful axis management. Choosing birth_country_current over birth_country was also a meaningful decision — using historical borders would significantly inflate some countries' totals and undercount others.
Results / Metrics
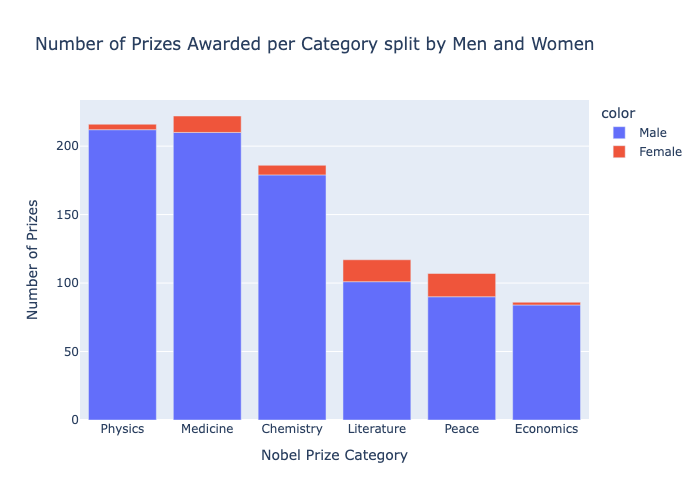
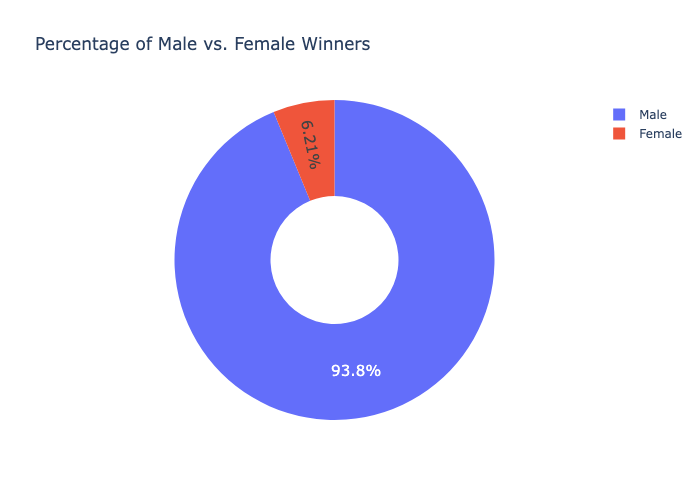
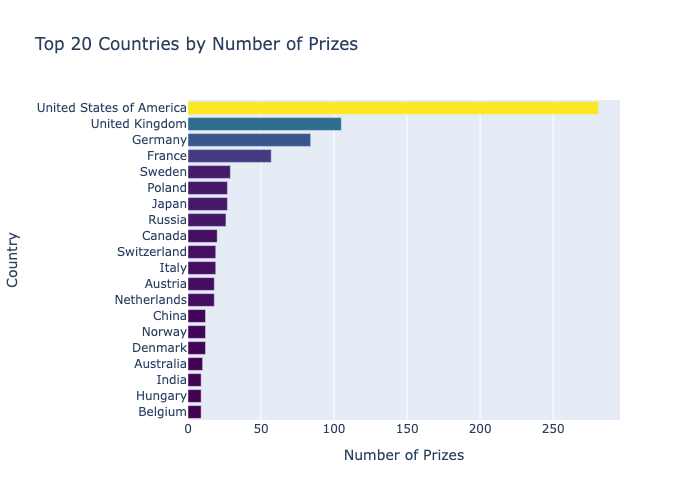
The analysis surfaced some genuinely interesting patterns: the US surged past every other country around the 1930s and never looked back, fewer than 6% of individual prizes have gone to women, and laureates are winning about a decade later in life now than they were in 1900. It gave me solid practice with the full pandas-to-visualisation pipeline and reinforced when to reach for Plotly (interactive exploration), Matplotlib (fine-grained multi-axis control), and Seaborn (statistical summaries). If I were to extend it, I'd add a time-series breakdown by category to see whether the age trend holds equally across Physics, Chemistry, and Medicine.
Screenshots
Click to enlarge.
Click to enlarge.
Videos
No videos available yet.