Data Preprocessing Pipeline — NYC Airbnb
This pipeline takes one of the messiest real-world datasets available — the NYC Airbnb Open Data — and transforms it into a clean, analysis-ready form through a fully modular, reusable architecture. The codebase is structured around four independent classes (DataLoader, DataCleaner, DataVisualizer, PipelineReport) that can each be imported individually into any downstream data project.
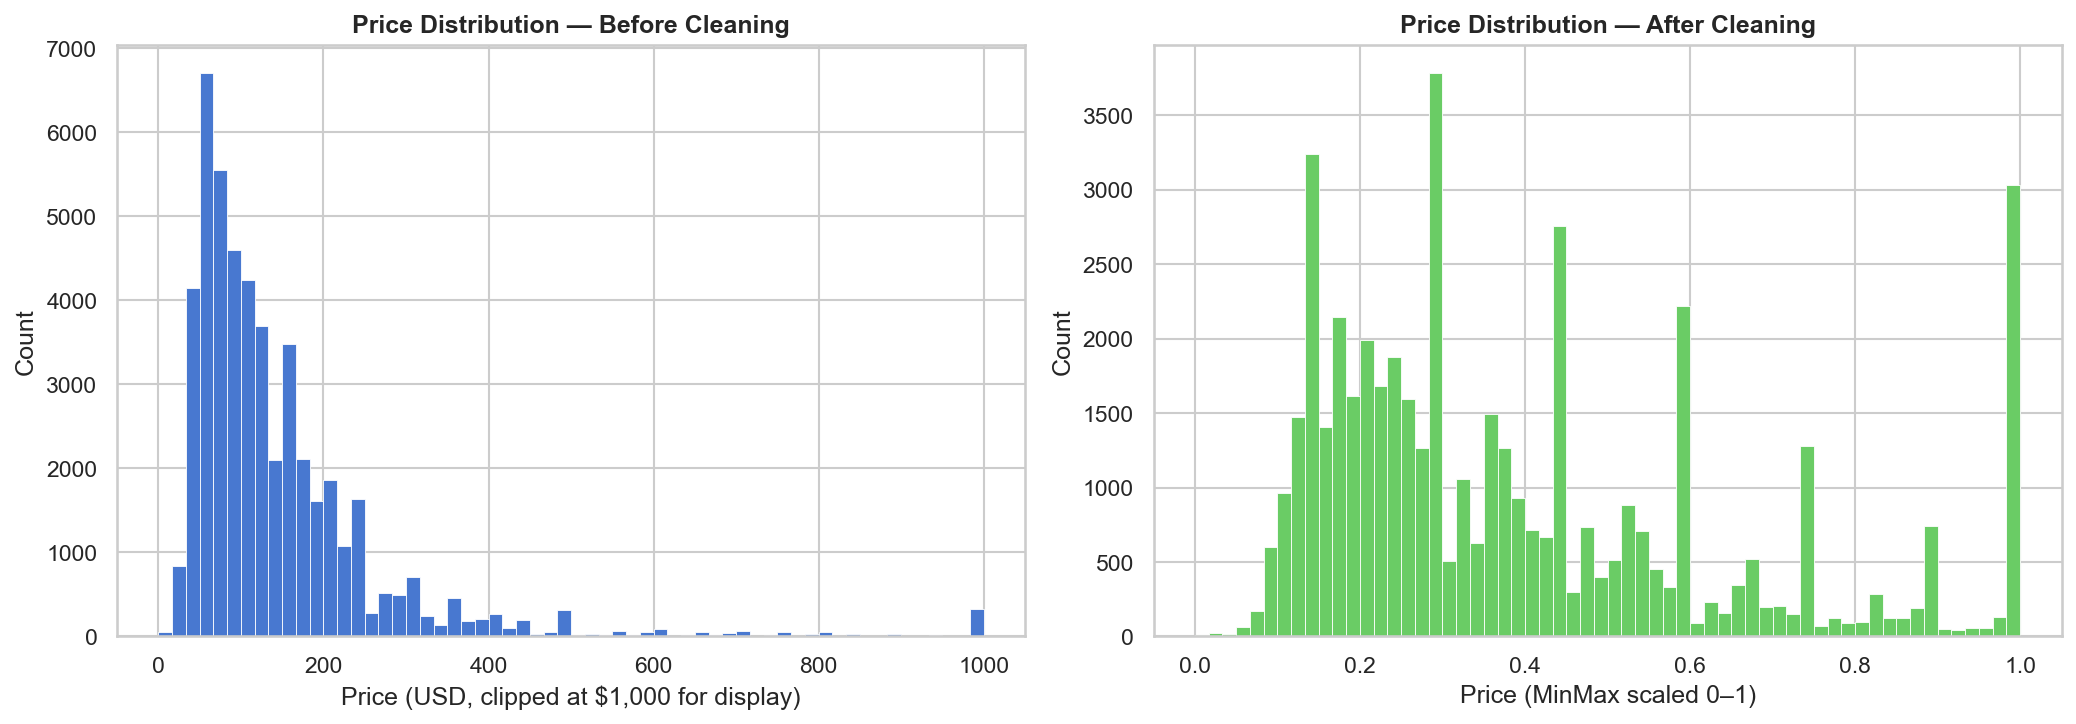
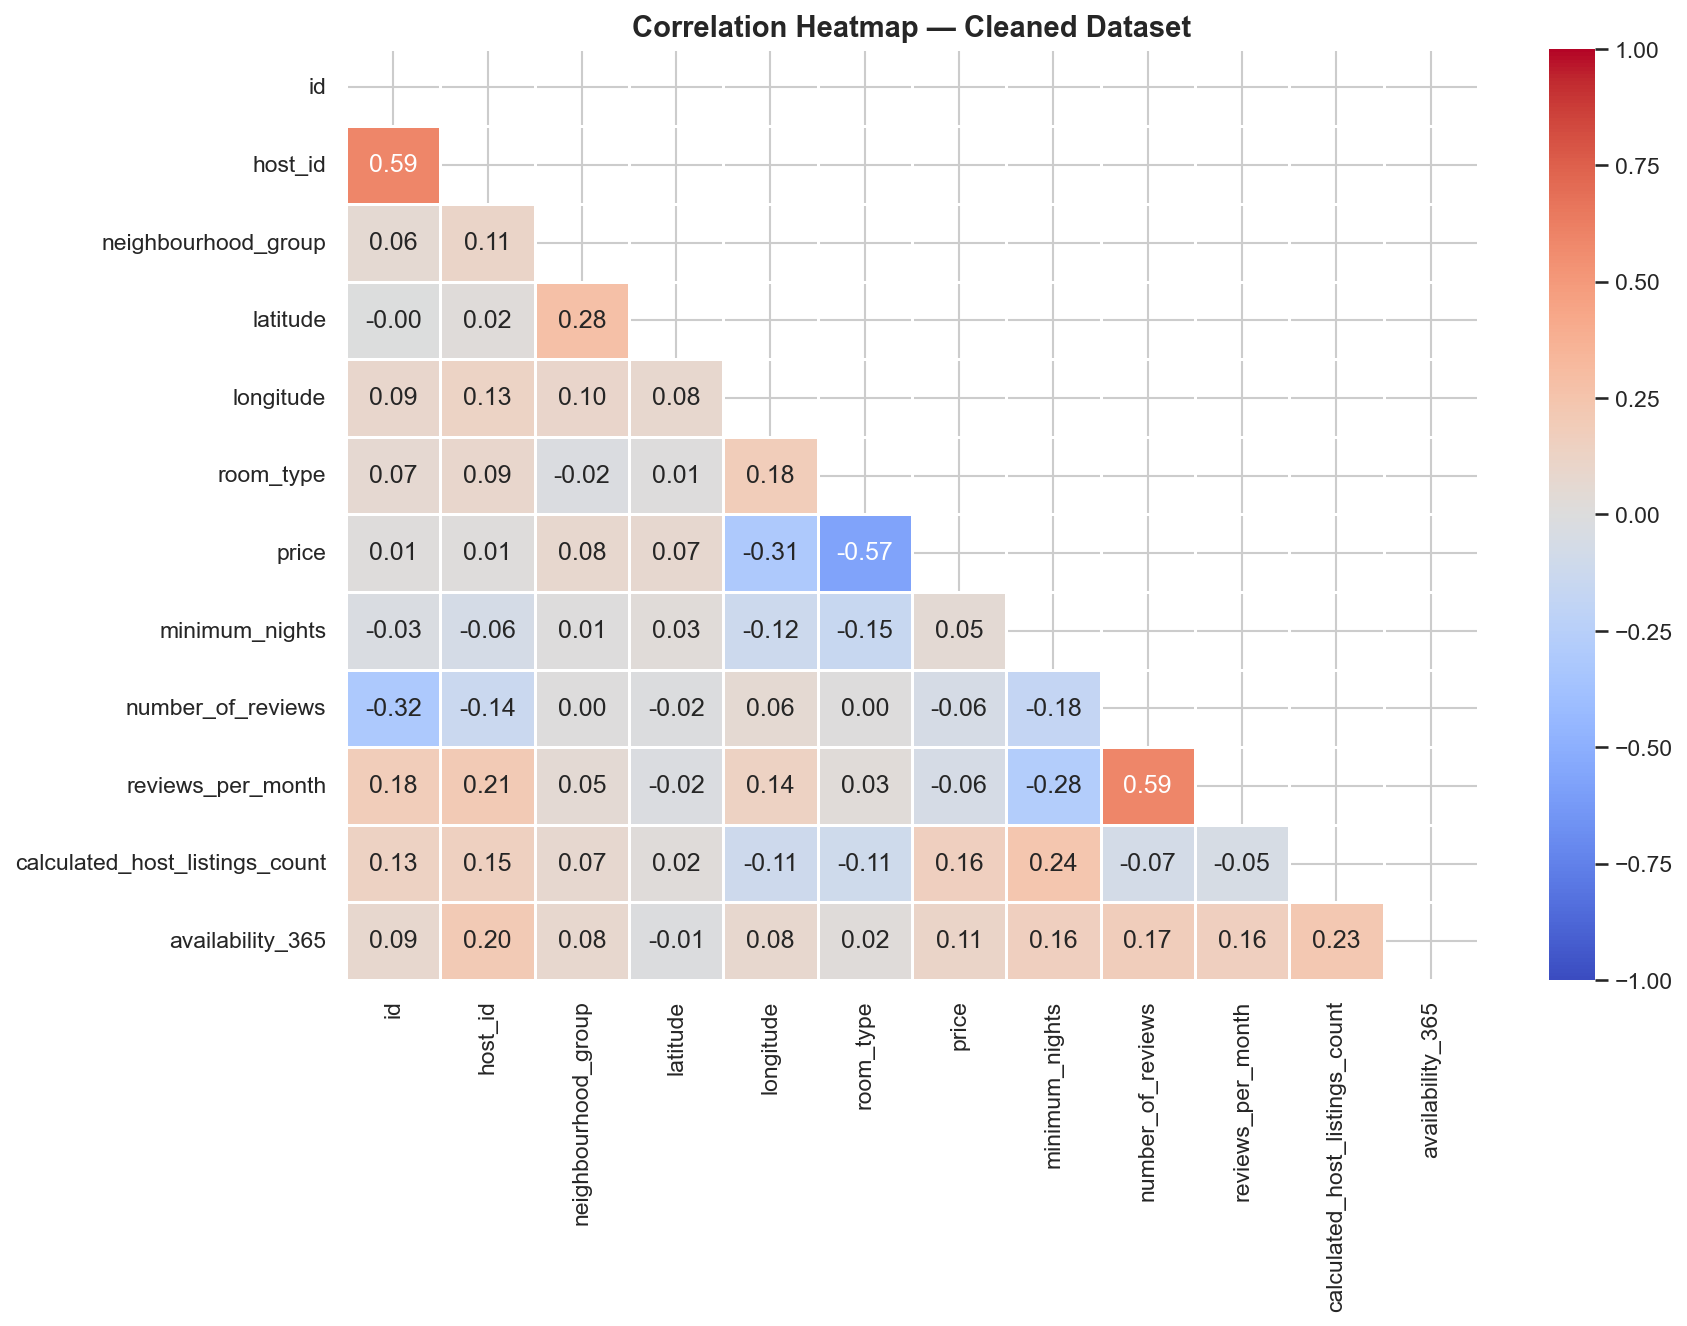
The pipeline runs eight deterministic steps: load, inspect, handle missing values, remove duplicates, cap outliers via IQR fencing, label-encode categoricals, MinMax-scale numerics, and print a full transformation report. Every decision is logged internally, and five auto-generated charts make each transformation visible and explainable — from raw missing-value bands to before/after price distributions and a Pearson correlation heatmap on the cleaned data.
Quick Facts
Overview
Problem
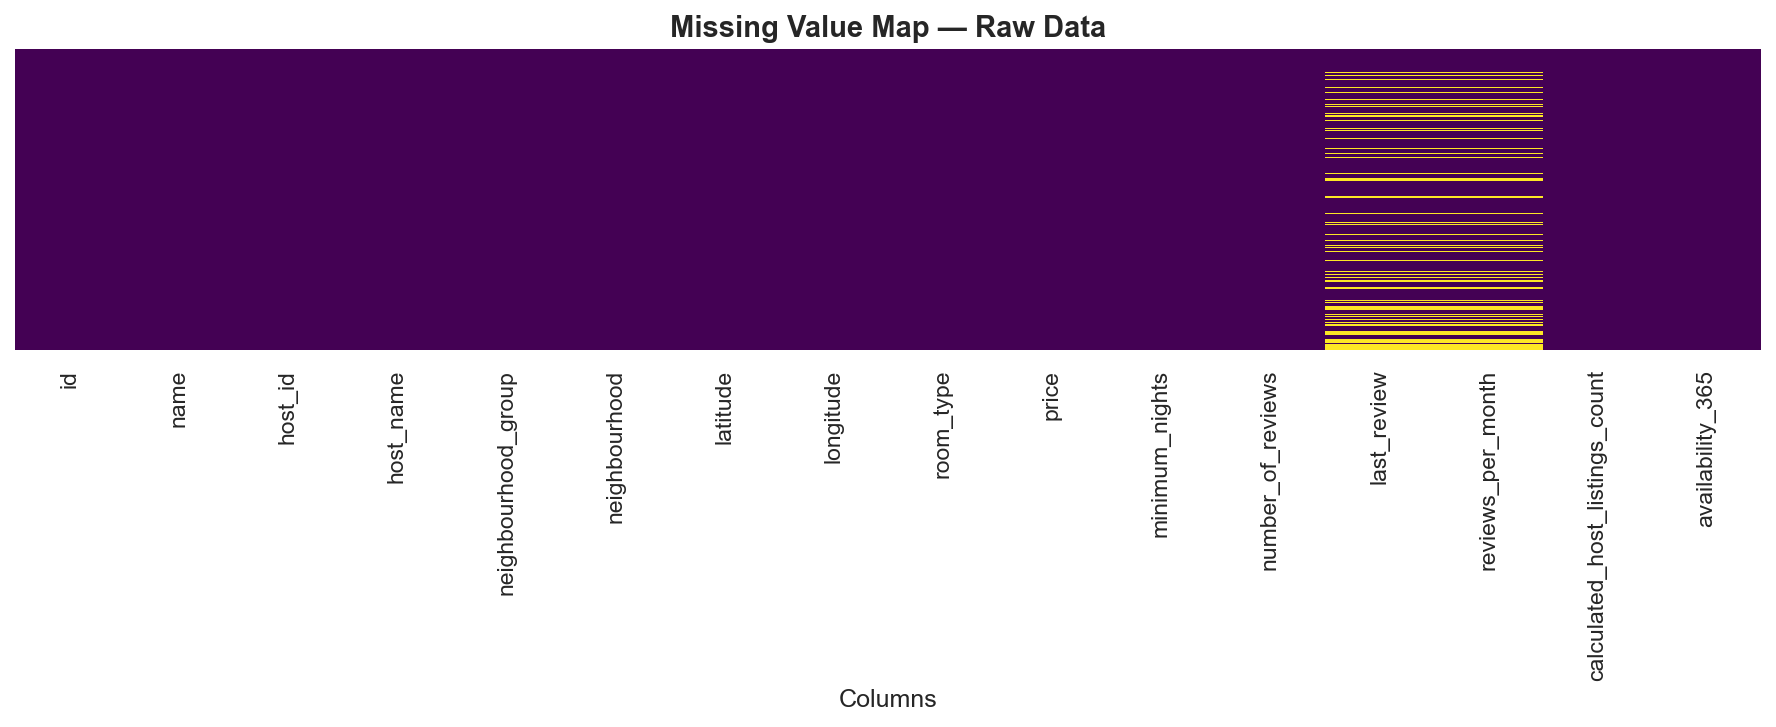
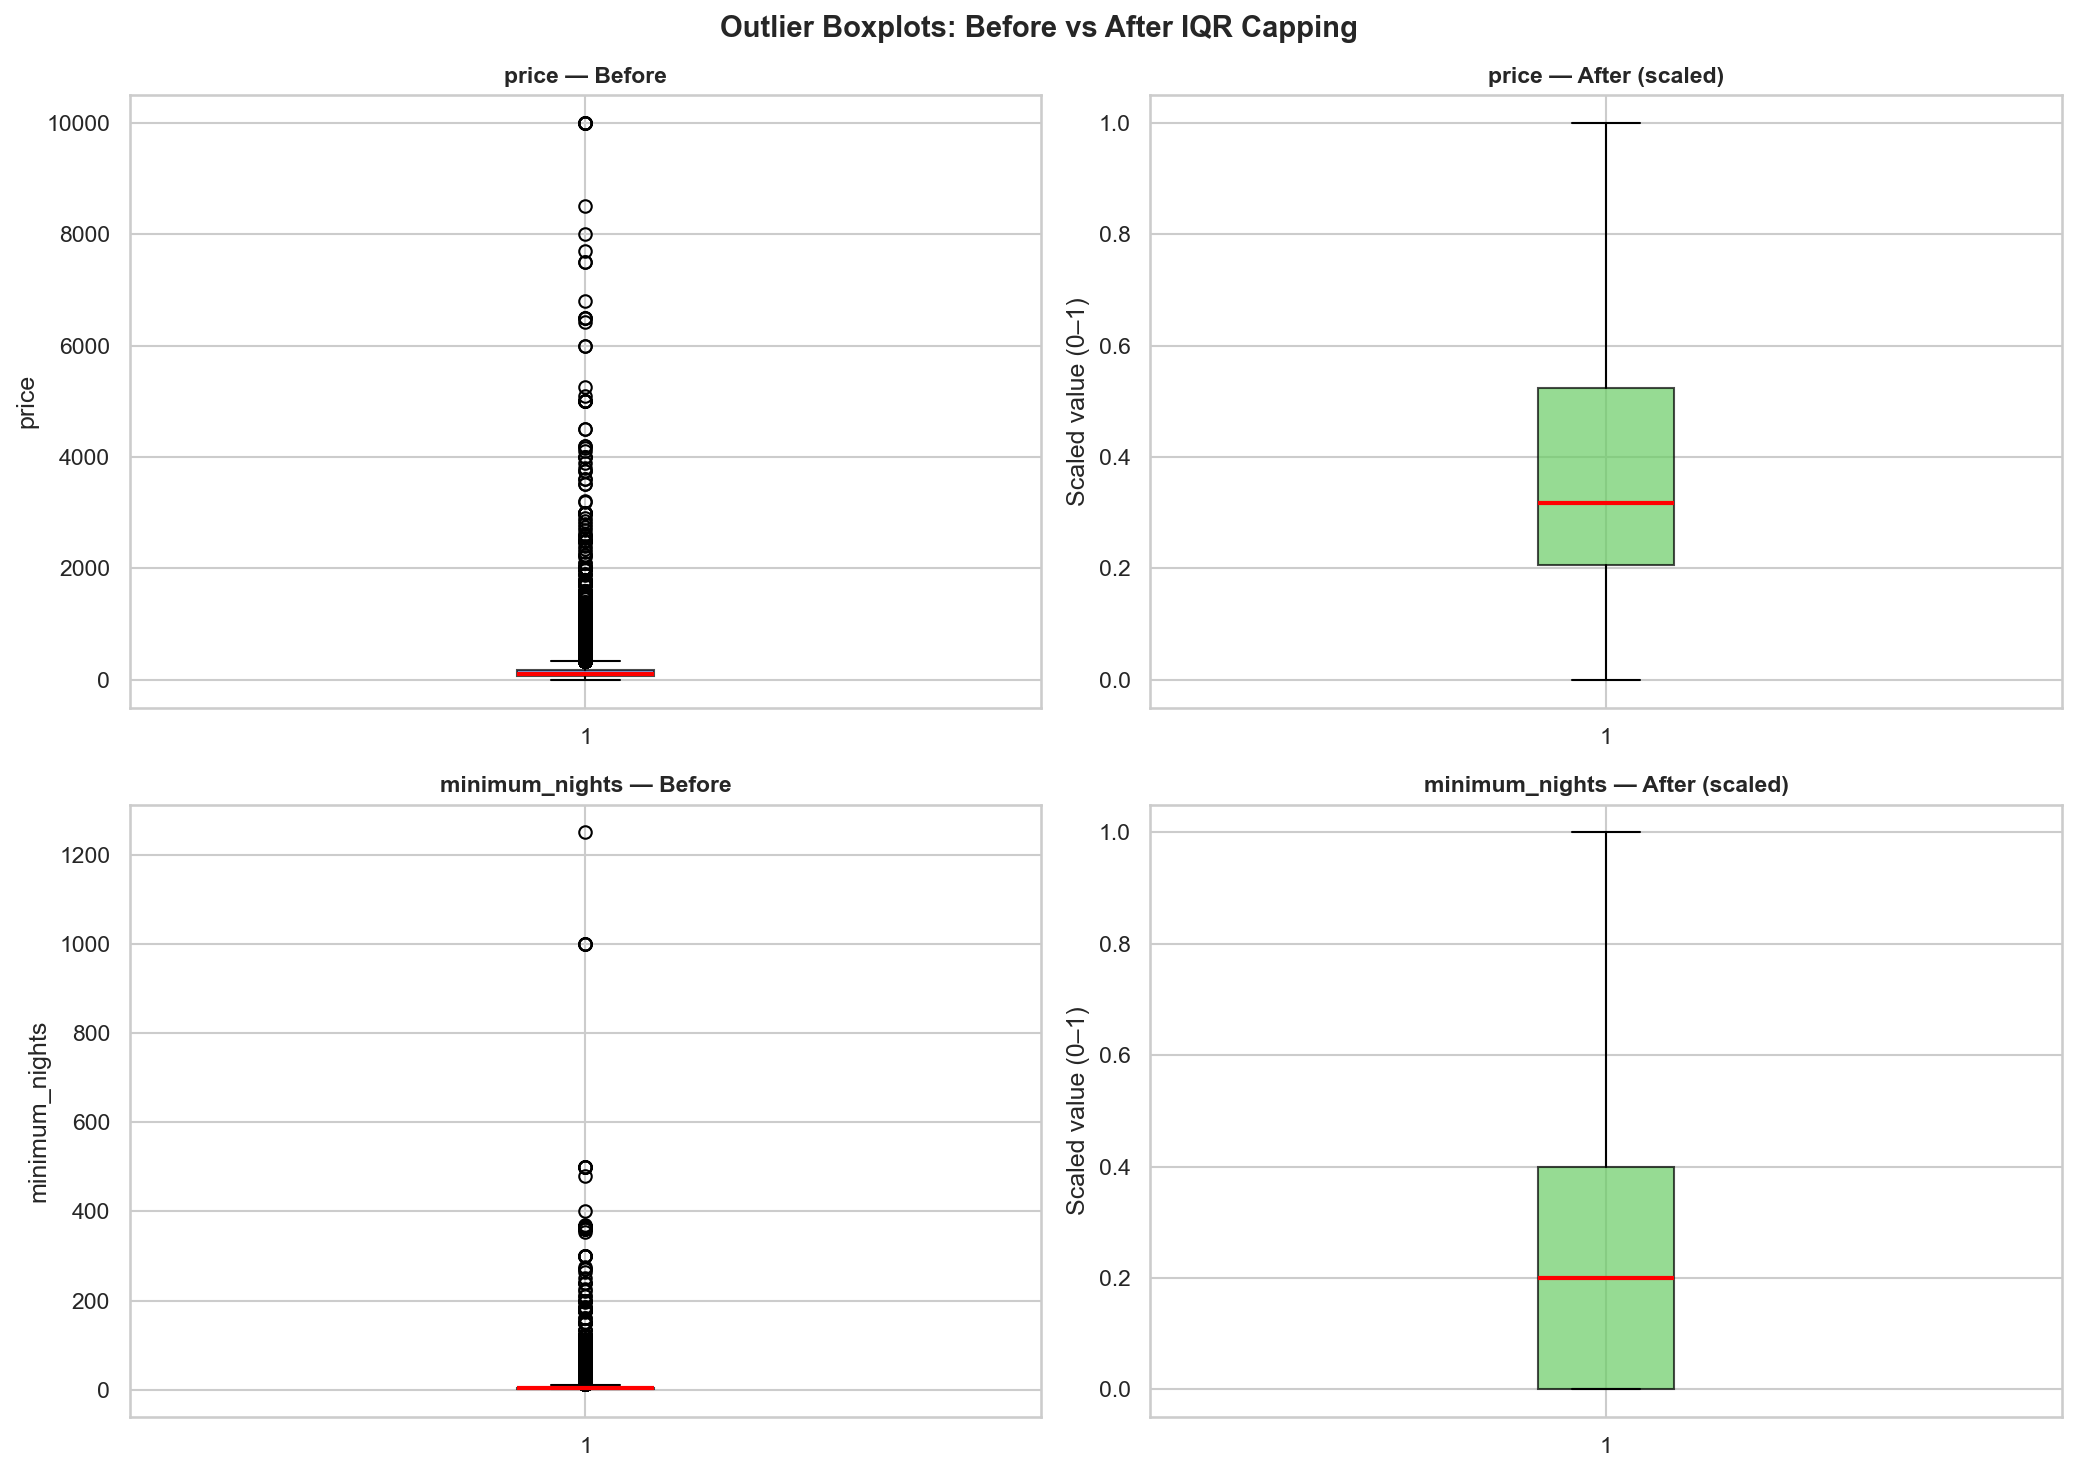
Raw data is rarely clean. Real-world tabular datasets arrive with missing cells, extreme outliers, inconsistently typed categoricals, and numeric features on wildly different scales. Processing this ad-hoc in a flat script leads to code that is hard to test, impossible to reuse, and that silently discards valid data. The NYC Airbnb dataset is an ideal stress test: 20.56% of rows have null review fields, price ranges from $0 to $10,000, and minimum_nights contains values of 365+ — all structurally different problems that need principled, documented solutions.
Solution
A class-based pipeline separates each concern into a dedicated, independently importable component. DataLoader handles I/O and observation only (no mutations). DataCleaner chains all transformations — null imputation, deduplication, IQR capping, label encoding, MinMax scaling — and logs every step into a report dict. DataVisualizer generates five before/after diagnostic charts saved to ./plots/. PipelineReport formats and prints the full transformation summary to stdout. The architecture means any class can be swapped, extended, or tested in isolation without touching the others, and the whole pipeline runs with a single `python pipeline.py`.
Challenges
The most consequential design decisions were about what not to do. Dropping outlier rows would silently remove real market segments (a $2,000/night penthouse is not bad data). Using StandardScaler on right-skewed distributions like price and minimum_nights would produce unintuitive z-scores. One-hot encoding the two low-cardinality categoricals would add 6 redundant columns. Each choice required a deliberate tradeoff analysis — IQR capping preserves rows while bounding the distorting effect, MinMaxScaler produces a directly interpretable [0,1] range regardless of distribution shape, and label encoding keeps the schema compact for tree-based downstream models.
Results / Metrics
- 48,895 rows processed with zero row loss across all cleaning steps
- 20,141 missing cells reduced to 0 via targeted imputation (no rows dropped)
- 2,972 price outliers (6.1%) and 6,607 minimum_nights outliers (13.5%) capped via IQR fencing
- 0 duplicate rows found, confirming the dataset's integrity at ingestion
- Five before/after diagnostic charts auto-generated and saved to ./plots/
- Key insight: 35.9% of listings show zero availability for the coming year — a distinct segment worth flagging in any demand-modelling exercise
- Architecture validated as reusable: swapping the CSV path and column names is sufficient to apply the same pipeline to a different dataset
Screenshots
Click to enlarge.
Click to enlarge.
Videos
No videos available yet.