Data Projects
Browse my data work tagged with "visualisation".

Android App Store Analysis
DataAnalyses 10,000+ Google Play Store apps with pandas and Plotly to answer real market questions: which categories are most competitive, how much a paid app earns, and how many downloads you give up by charging.
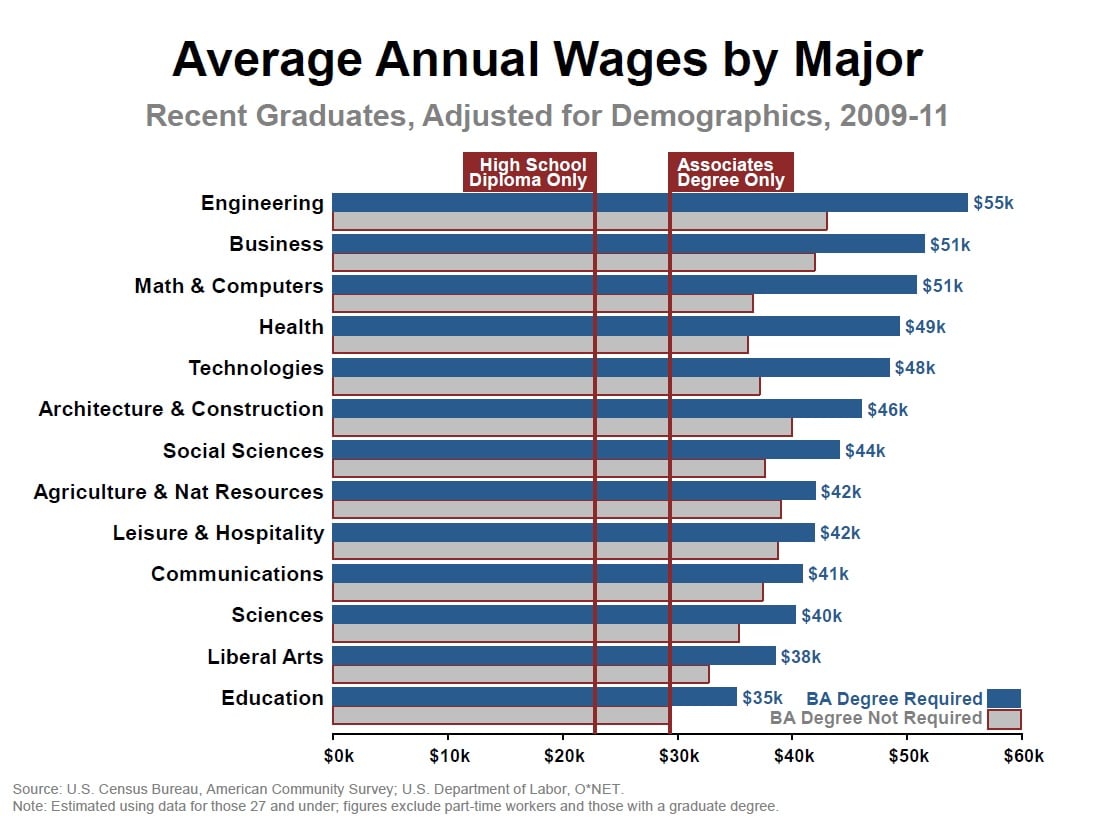
College Major vs Your Salary — Data Exploration with Pandas
DataDoes picking STEM actually guarantee better earnings? This analysis of 1.2M graduate salaries across 51 majors says it's more complicated. STEM leads on starting salary — but growth rates are nearly identical to HASS, and Economics' earnings ceiling beats every engineering field.
Data Preprocessing Pipeline — NYC Airbnb
DataA production-grade, class-based data preprocessing pipeline built in Python on the NYC Airbnb Open Dataset (48,895 listings). Handles missing values, outliers, duplicates, encoding, and scaling — then generates five before/after diagnostic visualisations.

Google Trends Time Series Analysis
DataThree economic signals — Tesla, Bitcoin, and US unemployment — each paired with Google Trends search data across mismatched time frequencies and aligned by resampling. The 2020 COVID shock compressed months of unemployment pattern into weeks.
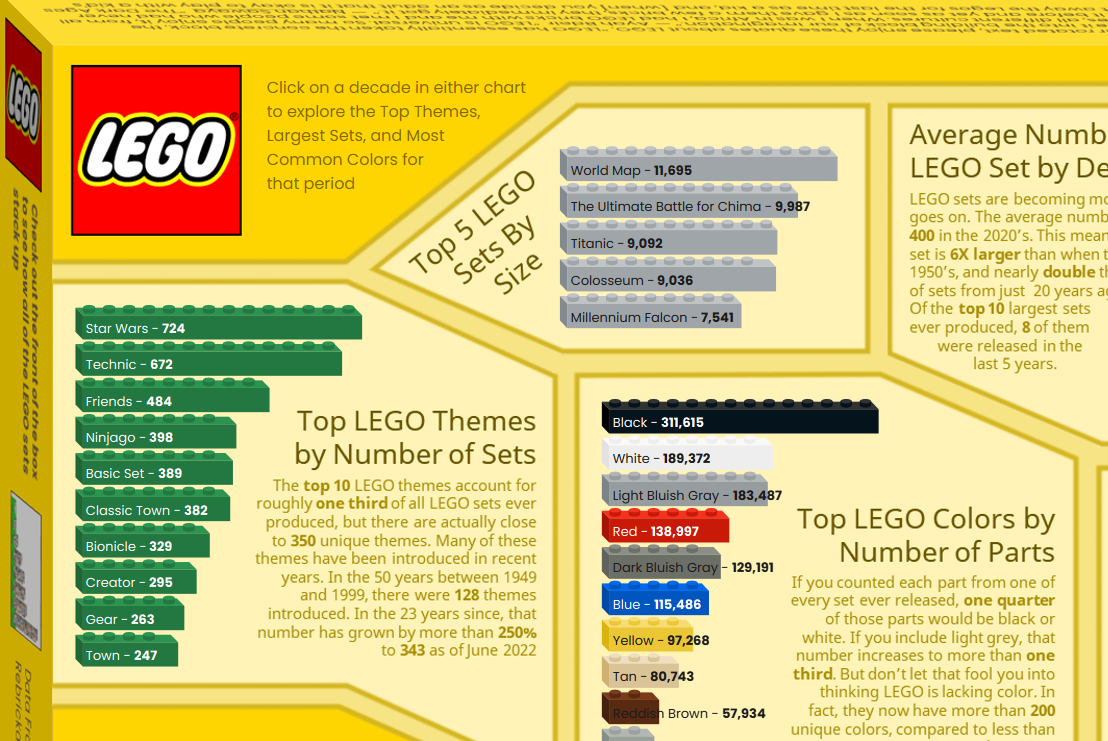
LEGO Dataset Analysis
DataLEGO nearly went bankrupt in 1998. This project joins six relational tables across 15,710 sets to measure exactly what changed — licensed share grew from 0% to 31.5%, average complexity 8×, and minifigure density 57% from 1970 to 2010.
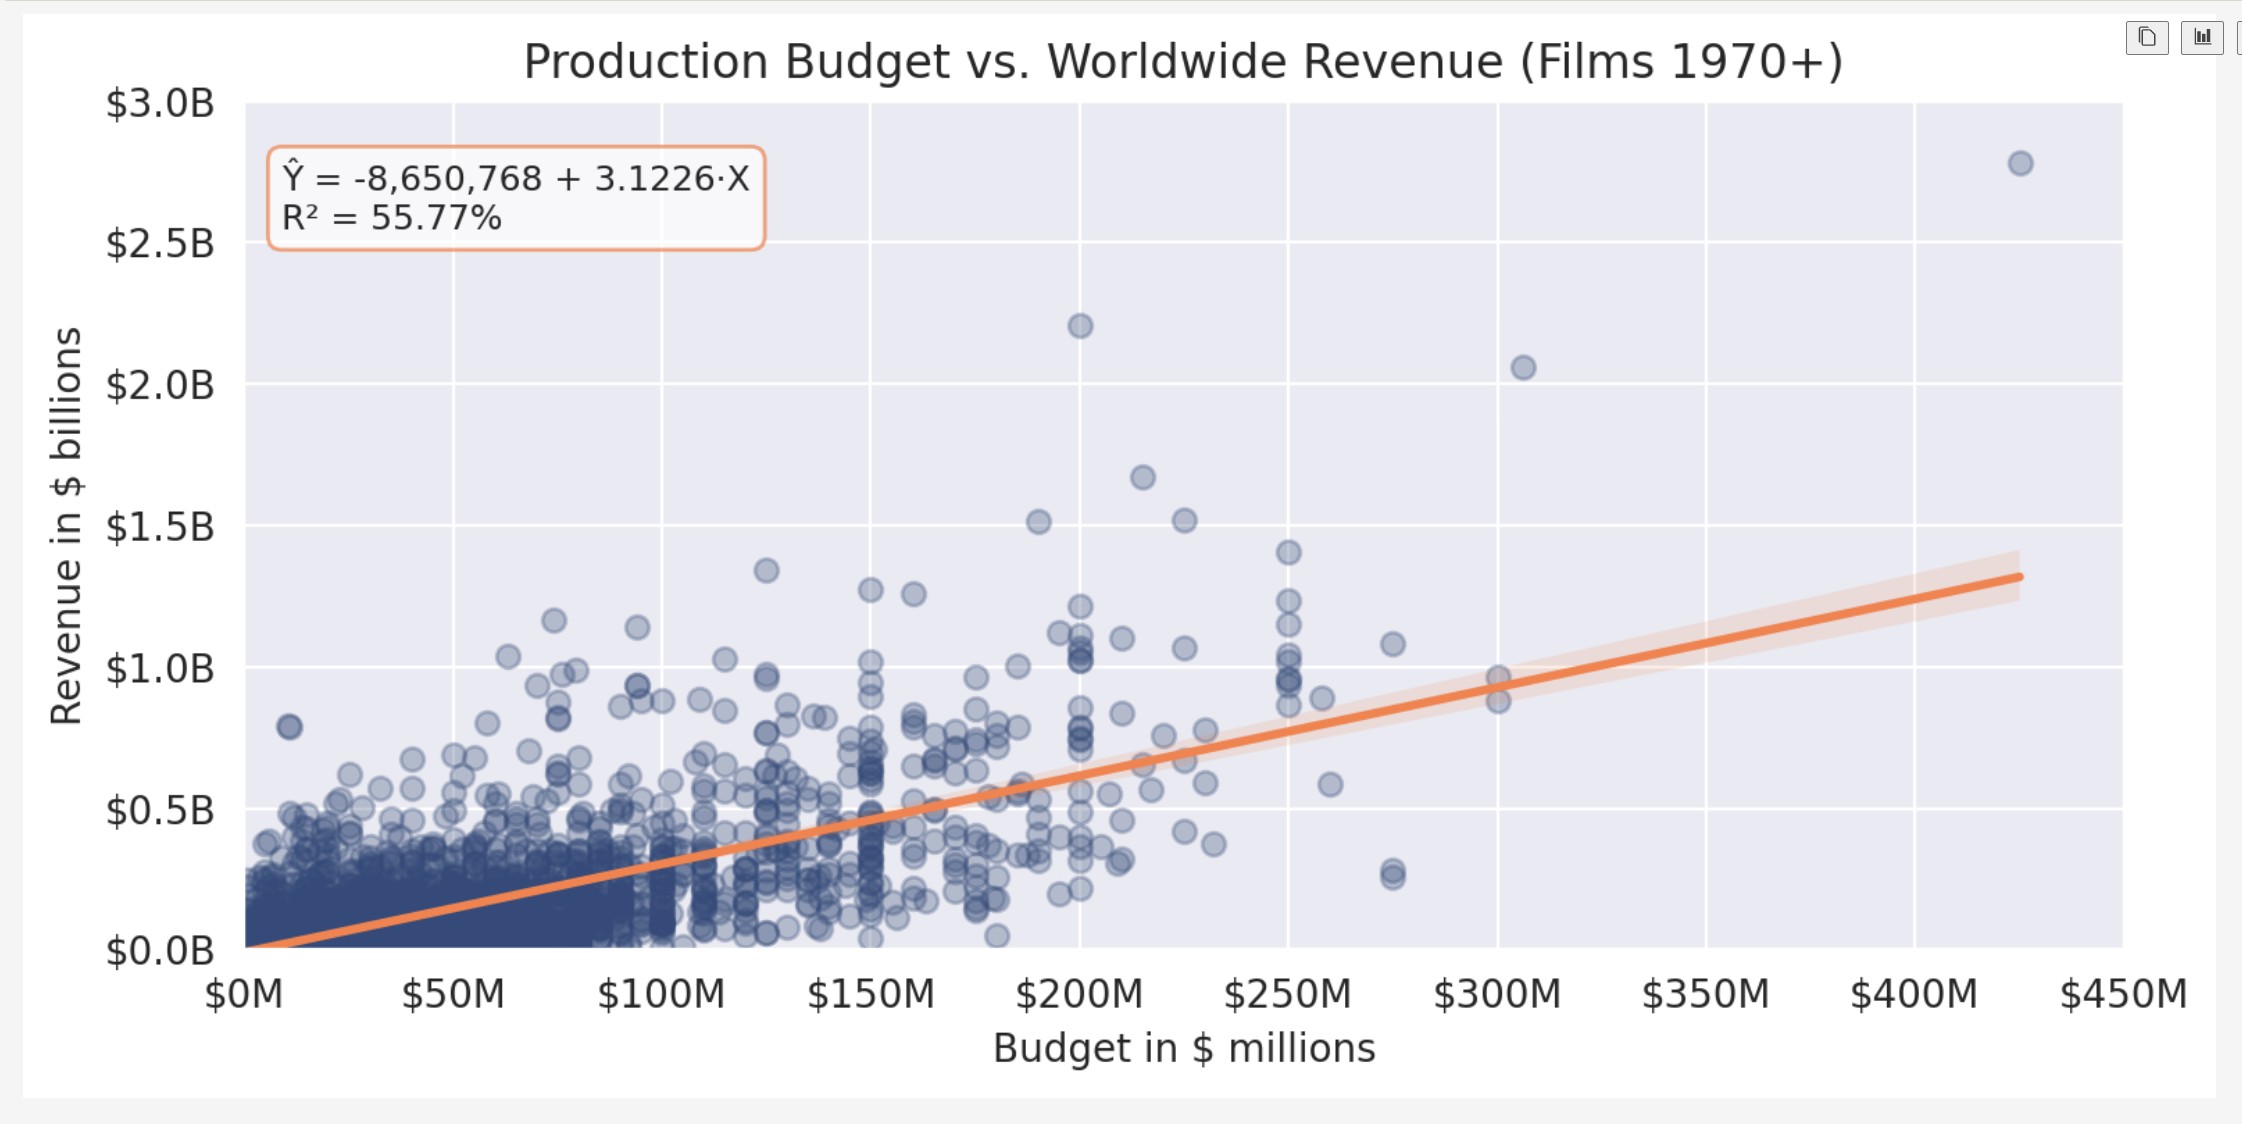
Movie Budget Linear Regression Analysis
DataAcross 5,384 films from 1915–2018, a linear regression on budget vs. worldwide gross gives a slope of 3.12 (R²=55.77%) — every dollar of budget is associated with $3.12 in revenue, yet 37.28% of films still failed to recoup their costs.

Nobel Prize Data Analysis
DataExplores 120+ years of Nobel Prize records to uncover trends in gender, nationality, research institutions, and laureate age — using Plotly choropleth maps, Seaborn regression plots, and Matplotlib dual-axis charts.

NumPy NDArray Computation
DataNumPy treats images as numbers — a 768 × 1024 photograph is a 3D array of integers. This project works through ndarray operations from first principles: slicing, broadcasting, matrix multiplication, and pixel-level transforms like greyscale conversion and colour inversion.
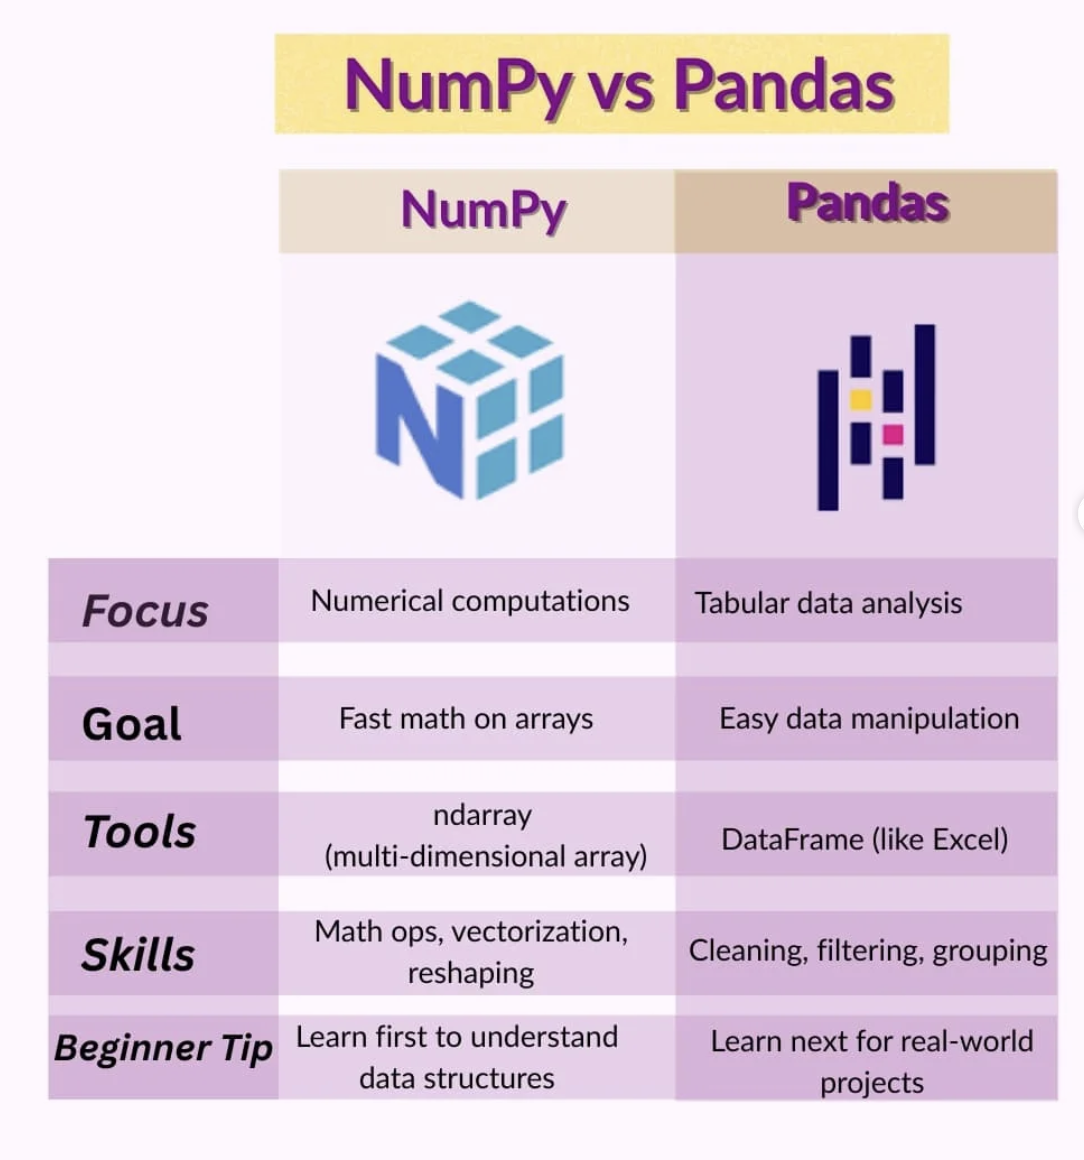
NumPy vs Pandas Performance Benchmark
DataI benchmarked NumPy and Pandas across seven common operations at 100k, 1M, and 10M rows to find out exactly when each library wins — and by how much. The answer turned out to be more nuanced than I expected.

Programming Language Workforce Strategy — Data Analysis
DataStack Overflow lost 97.7% of its post volume since 2016 — and its momentum now anti-correlates with hiring demand. This project proves the signal is broken, then builds a four-source replacement index to answer which languages to hire for.

Semmelweis Handwashing Data Analysis
DataRe-examination of Dr Semmelweis's 1861 hospital records from Vienna General Hospital (1841–1849). Mandatory handwashing in June 1846 cut the average monthly death rate from 10.5% to 5.0% — confirmed statistically at p ≈ 0.00025.
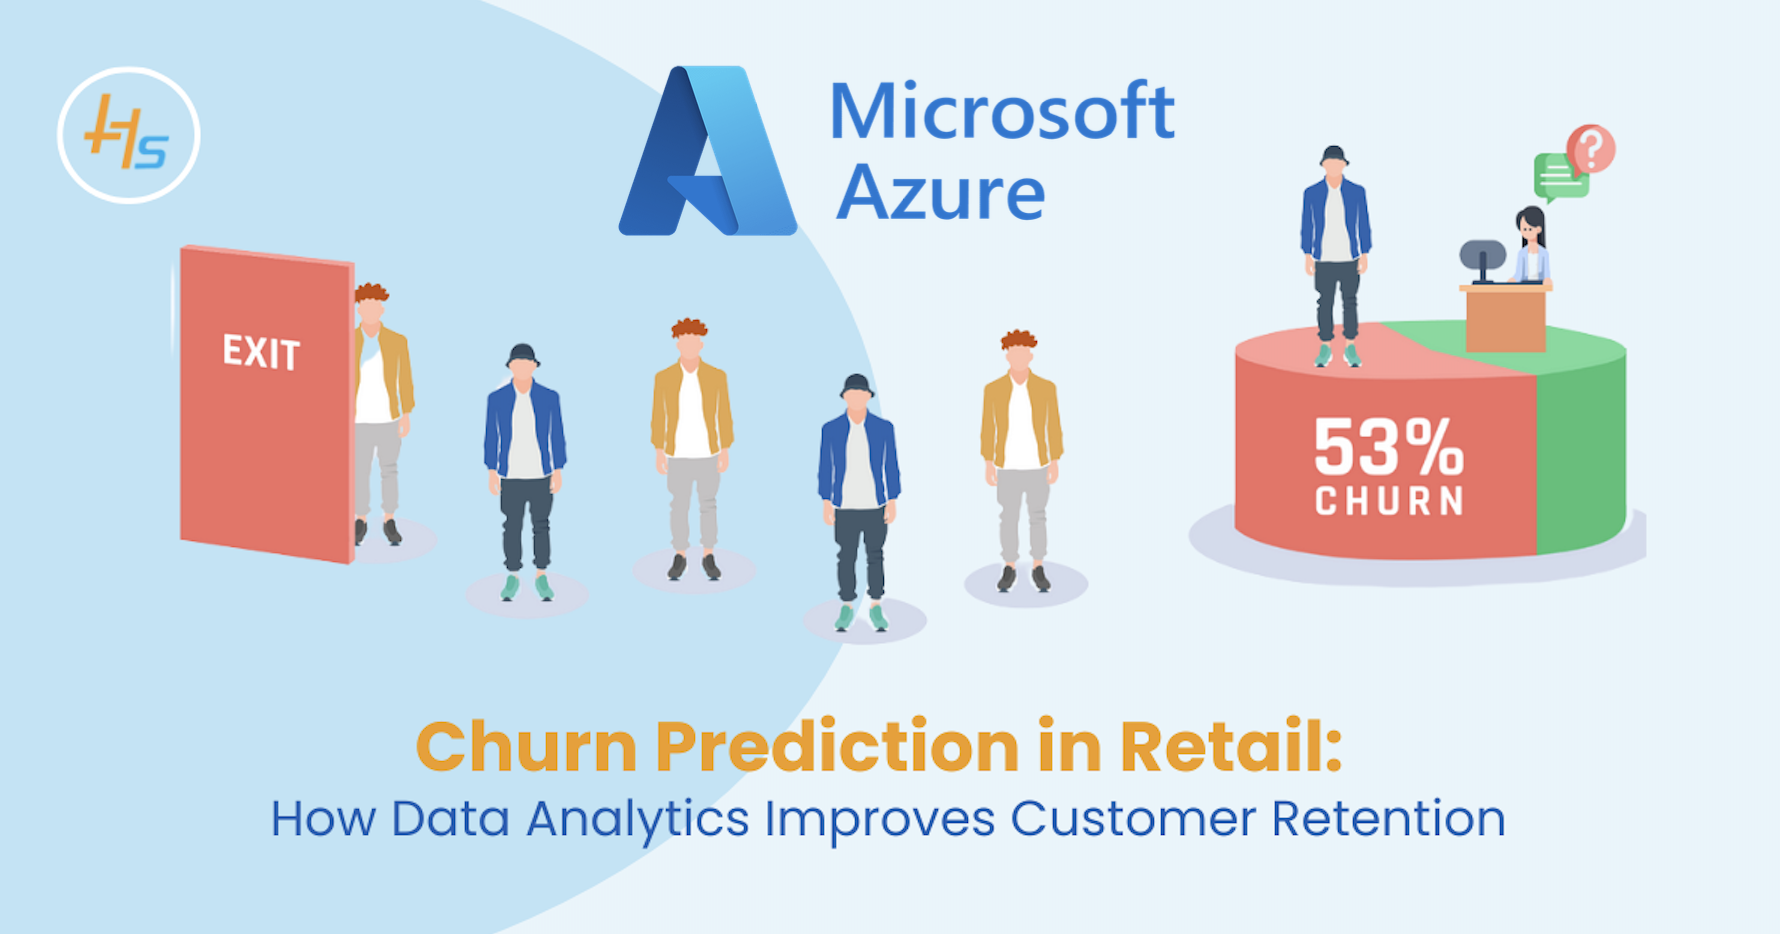
Telco Customer Churn Predictor
DataChurn prediction with plain-language risk explanations a retention team can act on. Logistic Regression wins (ROC-AUC 0.8362), benchmarked against Amazon Bedrock Claude Haiku 4.5 zero-shot — tied at 70%. Flask API on Azure.
No projects found
No projects match the current filter.